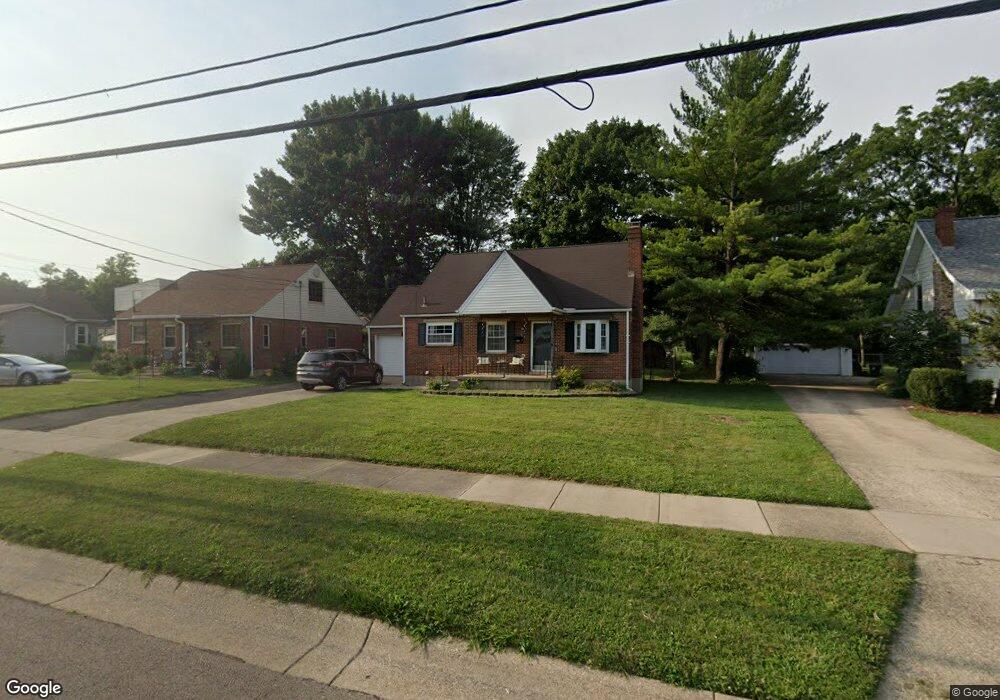
4217 Central Ave Middletown, OH 45044
El Dorado-Williamsdale NeighborhoodEstimated Value: $181,000 - $223,000
2
Beds
1
Bath
1,344
Sq Ft
$152/Sq Ft
Est. Value
About This Home
This home is located at 4217 Central Ave, Middletown, OH 45044 and is currently estimated at $204,657, approximately $152 per square foot. 4217 Central Ave is a home located in Butler County with nearby schools including Miller Ridge Elementary School, Highview 6th Grade Center, and Middletown Middle School.
Ownership History
Date
Name
Owned For
Owner Type
Purchase Details
Closed on
Nov 26, 2013
Sold by
Barlow John W and Barlow Marilyn
Bought by
Barlow Eric J and Barlow Crystal M
Current Estimated Value
Home Financials for this Owner
Home Financials are based on the most recent Mortgage that was taken out on this home.
Original Mortgage
$55,650
Outstanding Balance
$41,479
Interest Rate
4.14%
Mortgage Type
New Conventional
Estimated Equity
$163,178
Purchase Details
Closed on
Apr 24, 2001
Sold by
Estate Of Ruth Williams
Bought by
Barlow John W and Barlow Marilyn
Home Financials for this Owner
Home Financials are based on the most recent Mortgage that was taken out on this home.
Original Mortgage
$64,850
Interest Rate
7.03%
Mortgage Type
Purchase Money Mortgage
Purchase Details
Closed on
Jul 6, 1994
Sold by
Rossi Robert E
Bought by
Williams Ruth
Create a Home Valuation Report for This Property
The Home Valuation Report is an in-depth analysis detailing your home's value as well as a comparison with similar homes in the area
Home Values in the Area
Average Home Value in this Area
Purchase History
| Date | Buyer | Sale Price | Title Company |
|---|---|---|---|
| Barlow Eric J | -- | None Available | |
| Barlow John W | $86,500 | Prodigy Title Agency Inc | |
| Williams Ruth | $75,900 | -- |
Source: Public Records
Mortgage History
| Date | Status | Borrower | Loan Amount |
|---|---|---|---|
| Open | Barlow Eric J | $55,650 | |
| Closed | Barlow John W | $64,850 |
Source: Public Records
Tax History Compared to Growth
Tax History
| Year | Tax Paid | Tax Assessment Tax Assessment Total Assessment is a certain percentage of the fair market value that is determined by local assessors to be the total taxable value of land and additions on the property. | Land | Improvement |
|---|---|---|---|---|
| 2024 | $2,415 | $46,760 | $8,320 | $38,440 |
| 2023 | $2,401 | $48,710 | $8,320 | $40,390 |
| 2022 | $1,936 | $33,310 | $8,320 | $24,990 |
| 2021 | $2,059 | $33,310 | $8,320 | $24,990 |
| 2020 | $2,137 | $33,310 | $8,320 | $24,990 |
| 2019 | $1,710 | $24,530 | $8,870 | $15,660 |
| 2018 | $1,745 | $24,530 | $8,870 | $15,660 |
| 2017 | $1,748 | $24,530 | $8,870 | $15,660 |
| 2016 | $1,557 | $23,590 | $8,870 | $14,720 |
| 2015 | $1,534 | $23,590 | $8,870 | $14,720 |
| 2014 | $1,818 | $23,590 | $8,870 | $14,720 |
| 2013 | $1,818 | $29,600 | $8,870 | $20,730 |
Source: Public Records
Map
Nearby Homes
- 4401 Graydon Dr
- 209 Burton Rd
- 113 Lylburn Rd
- 101 Zachery Dr
- 15 N Elmer Dr
- 124 Marisa Dr
- 302 Lylburn Rd
- 4506 Marguerite Ct
- 4513 Hannah Dr
- 4529 Poppy Dr
- 304 S Highview Rd
- 117 Stolz Dr
- 20 Sycamore Terrace
- 4617 Timber Trail Dr
- 107 N Marshall Rd
- 4610 Carroll Lee Ln
- 116 Whisman Dr
- 202 Loretta Dr
- 4721 Creekview Dr
- 500 Dorset Dr
- 4215 Central Ave
- 4219 Central Ave
- 9 Curryer Rd
- 4211 Central Ave
- 4301 Central Ave
- 11 Curryer Rd
- 4218 Central Ave
- 4214 Central Ave
- 13 Curryer Rd
- 4205 Central Ave
- 4210 Central Ave
- 4300 Central Ave
- 10 Curryer Rd
- 4208 Central Ave
- 4304 Central Ave
- 12 Curryer Rd
- 4203 Central Ave
- 4206 Central Ave
- 17 Curryer Rd
- 50 N Breiel Blvd