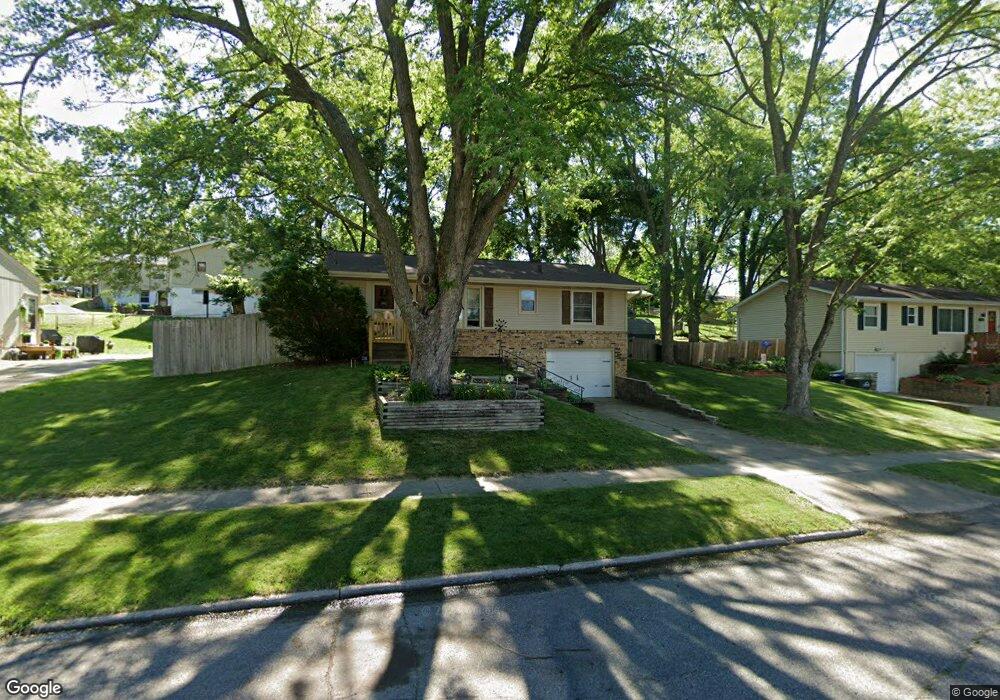
4217 SE 10th St Des Moines, IA 50315
South Central DSM NeighborhoodEstimated Value: $176,000 - $201,000
3
Beds
1
Bath
912
Sq Ft
$209/Sq Ft
Est. Value
About This Home
This home is located at 4217 SE 10th St, Des Moines, IA 50315 and is currently estimated at $190,323, approximately $208 per square foot. 4217 SE 10th St is a home located in Polk County with nearby schools including Lovejoy Elementary School, Weeks Middle School, and Lincoln High School.
Ownership History
Date
Name
Owned For
Owner Type
Purchase Details
Closed on
Oct 7, 2003
Sold by
Bagbey Faith M
Bought by
Sloan Julie
Current Estimated Value
Home Financials for this Owner
Home Financials are based on the most recent Mortgage that was taken out on this home.
Original Mortgage
$104,000
Outstanding Balance
$48,875
Interest Rate
6.43%
Mortgage Type
Purchase Money Mortgage
Estimated Equity
$141,448
Purchase Details
Closed on
Jul 18, 2003
Sold by
Chubb Mark A and Mcmurty Chubb Teri A
Bought by
Bagbey Faith M
Home Financials for this Owner
Home Financials are based on the most recent Mortgage that was taken out on this home.
Original Mortgage
$95,000
Interest Rate
5.3%
Mortgage Type
Purchase Money Mortgage
Purchase Details
Closed on
Nov 28, 2000
Sold by
Vos Brad S and Vos Tabitha N
Bought by
Chubb Mark A and Mcmurtry Chubb Teri A
Home Financials for this Owner
Home Financials are based on the most recent Mortgage that was taken out on this home.
Original Mortgage
$84,541
Interest Rate
7.86%
Mortgage Type
FHA
Create a Home Valuation Report for This Property
The Home Valuation Report is an in-depth analysis detailing your home's value as well as a comparison with similar homes in the area
Home Values in the Area
Average Home Value in this Area
Purchase History
| Date | Buyer | Sale Price | Title Company |
|---|---|---|---|
| Sloan Julie | $103,500 | -- | |
| Bagbey Faith M | $101,000 | -- | |
| Chubb Mark A | $84,500 | -- |
Source: Public Records
Mortgage History
| Date | Status | Borrower | Loan Amount |
|---|---|---|---|
| Open | Sloan Julie | $104,000 | |
| Previous Owner | Bagbey Faith M | $95,000 | |
| Previous Owner | Chubb Mark A | $84,541 |
Source: Public Records
Tax History Compared to Growth
Tax History
| Year | Tax Paid | Tax Assessment Tax Assessment Total Assessment is a certain percentage of the fair market value that is determined by local assessors to be the total taxable value of land and additions on the property. | Land | Improvement |
|---|---|---|---|---|
| 2025 | $3,118 | $180,200 | $34,900 | $145,300 |
| 2024 | $3,118 | $169,000 | $32,300 | $136,700 |
| 2023 | $3,176 | $169,000 | $32,300 | $136,700 |
| 2022 | $3,150 | $143,600 | $28,200 | $115,400 |
| 2021 | $2,962 | $143,600 | $28,200 | $115,400 |
| 2020 | $3,072 | $127,300 | $24,900 | $102,400 |
| 2019 | $2,662 | $127,300 | $24,900 | $102,400 |
| 2018 | $2,630 | $107,600 | $20,700 | $86,900 |
| 2017 | $2,506 | $107,600 | $20,700 | $86,900 |
| 2016 | $2,438 | $101,200 | $19,200 | $82,000 |
| 2015 | $2,438 | $101,200 | $19,200 | $82,000 |
| 2014 | $2,388 | $102,200 | $19,100 | $83,100 |
Source: Public Records
Map
Nearby Homes
- 1201 E Philip St
- 705 E Watrous Ave
- 3909 SE 5th St
- 448 Scandia Ave
- 401 E Mckinley Ave
- 3616 SE 11th St
- 409 Wilmers Ave
- 904 E Hackley Ave
- 4316 SE 4th St
- 712 E Hackley Ave
- 801 E Hackley Ave
- 5205 SE 9th St
- 209 E Philip St
- 311 E Emma Ave
- 1600 Evergreen Ave
- 1617 Evergreen Ave
- 126 E Maxwelton Dr
- 118 E Watrous Ave
- 108 E Philip St
- 3303 SE 4th St
- 4301 SE 10th St
- 4216 SE 11th St
- 4210 SE 11th St
- 4300 SE 11th St
- 4309 SE 10th St
- 4201 SE 10th St
- 4216 SE 10th St
- 4300 SE 10th St
- 4308 SE 11th St
- 4210 SE 10th St
- 4308 SE 10th St
- 4121 SE 10th St
- 1002 E Philip St
- 4200 SE 10th St
- 4116 SE 11th St
- 1014 E Philip St
- 4314 SE 10th St
- 4217 SE 11th St
- 4211 SE 11th St
- 4301 SE 11th St