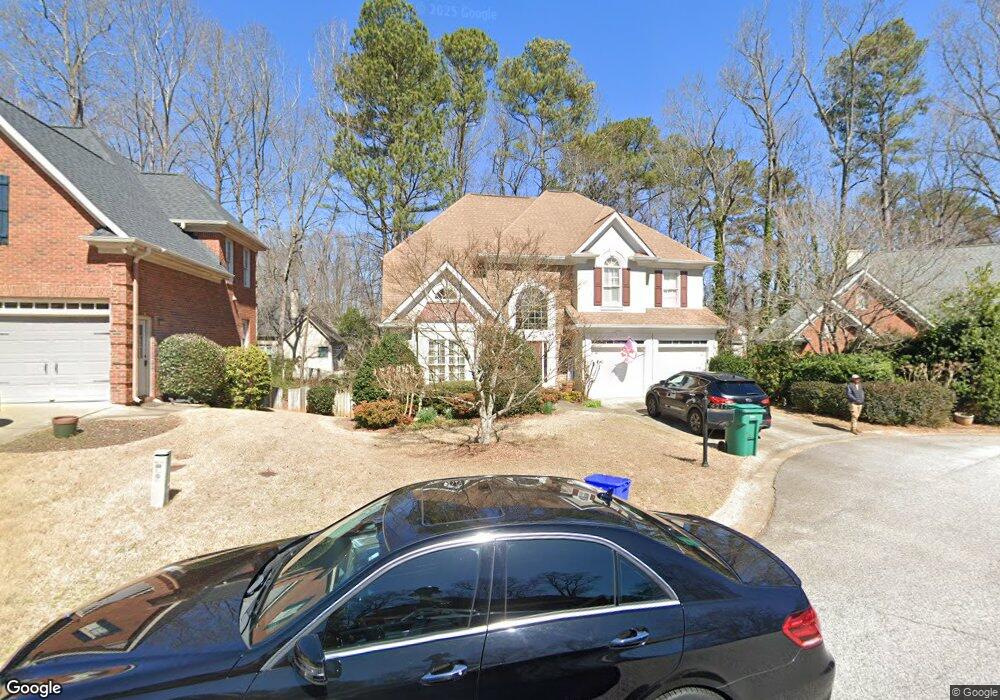
4217 Terrace Ct SE Unit 1 Smyrna, GA 30082
Estimated Value: $600,000 - $750,000
4
Beds
3
Baths
2,368
Sq Ft
$289/Sq Ft
Est. Value
About This Home
This home is located at 4217 Terrace Ct SE Unit 1, Smyrna, GA 30082 and is currently estimated at $684,553, approximately $289 per square foot. 4217 Terrace Ct SE Unit 1 is a home located in Cobb County with nearby schools including King Springs Elementary School, Griffin Middle School, and Campbell High School.
Ownership History
Date
Name
Owned For
Owner Type
Purchase Details
Closed on
Apr 27, 2006
Sold by
Miller Craig E and Miller Stefanie
Bought by
Geary Timothy E and Geary Elizabeth
Current Estimated Value
Home Financials for this Owner
Home Financials are based on the most recent Mortgage that was taken out on this home.
Original Mortgage
$250,000
Outstanding Balance
$143,417
Interest Rate
6.33%
Mortgage Type
Stand Alone Refi Refinance Of Original Loan
Estimated Equity
$541,136
Purchase Details
Closed on
Sep 30, 1997
Sold by
Redden Properties Inc
Bought by
Miller Craig E and Miller Stefanie
Home Financials for this Owner
Home Financials are based on the most recent Mortgage that was taken out on this home.
Original Mortgage
$213,750
Interest Rate
7.31%
Mortgage Type
New Conventional
Create a Home Valuation Report for This Property
The Home Valuation Report is an in-depth analysis detailing your home's value as well as a comparison with similar homes in the area
Home Values in the Area
Average Home Value in this Area
Purchase History
| Date | Buyer | Sale Price | Title Company |
|---|---|---|---|
| Geary Timothy E | $385,000 | -- | |
| Miller Craig E | $225,000 | -- |
Source: Public Records
Mortgage History
| Date | Status | Borrower | Loan Amount |
|---|---|---|---|
| Open | Geary Timothy E | $250,000 | |
| Previous Owner | Miller Craig E | $213,750 |
Source: Public Records
Tax History Compared to Growth
Tax History
| Year | Tax Paid | Tax Assessment Tax Assessment Total Assessment is a certain percentage of the fair market value that is determined by local assessors to be the total taxable value of land and additions on the property. | Land | Improvement |
|---|---|---|---|---|
| 2025 | $1,185 | $252,416 | $80,000 | $172,416 |
| 2024 | $1,185 | $252,416 | $80,000 | $172,416 |
| 2023 | $1,033 | $244,808 | $80,000 | $164,808 |
| 2022 | $4,378 | $178,900 | $36,000 | $142,900 |
| 2021 | $4,401 | $178,900 | $36,000 | $142,900 |
| 2020 | $4,401 | $178,900 | $36,000 | $142,900 |
| 2019 | $4,173 | $166,952 | $32,000 | $134,952 |
| 2018 | $3,642 | $142,432 | $32,000 | $110,432 |
| 2017 | $3,417 | $142,432 | $32,000 | $110,432 |
| 2016 | $2,692 | $114,288 | $32,000 | $82,288 |
| 2015 | $2,757 | $114,288 | $32,000 | $82,288 |
| 2014 | $2,783 | $114,288 | $0 | $0 |
Source: Public Records
Map
Nearby Homes
- 4222 Terrace Ct SE
- 3538 S Sherwood Rd SE Unit 5
- 1522 Grace Meadows Ln SE
- 3654 Lake Dr SE
- 550 Micayne Cir SE Unit 1
- 3568 Lake Dr SE
- 538 Micayne Cir SE Unit 3
- 3462 S Sherwood Rd SE
- 629 Dunton Cir SE
- 3844 Lake Dr SE
- 436 Concord Rd SE
- 3375 Emerson St SE
- 3933 N Cooper Lake Rd SE
- 3941 Lake Dr SE
- 1024 Magnolia Dr SE
- 3543 S Cobb Dr SE
- 3244 Hampton Ct SE
- 4215 Terrace Ct SE Unit 1
- 4219 Terrace Ct SE Unit 1
- 2220 Austin Lake Dr SE Unit 1
- 4213 Terrace Ct SE
- 2218 Austin Lake Dr SE
- 2222 Austin Lake Dr SE Unit 1
- 4211 Terrace Ct SE Unit 1
- 4216 Terrace Ct SE Unit 1
- 2216 Austin Lake Dr SE
- 4220 Terrace Ct SE
- 6204 Traymore Trace SE Unit 2
- 4214 Terrace Ct SE
- 6206 Traymore Trace SE
- 4209 Terrace Ct SE
- 0 Terrace Ct SE Unit 3198708
- 0 Terrace Ct SE Unit 7397436
- 0 Terrace Ct SE Unit 7360131
- 2224 Austin Lake Dr SE
- 4212 Terrace Ct SE