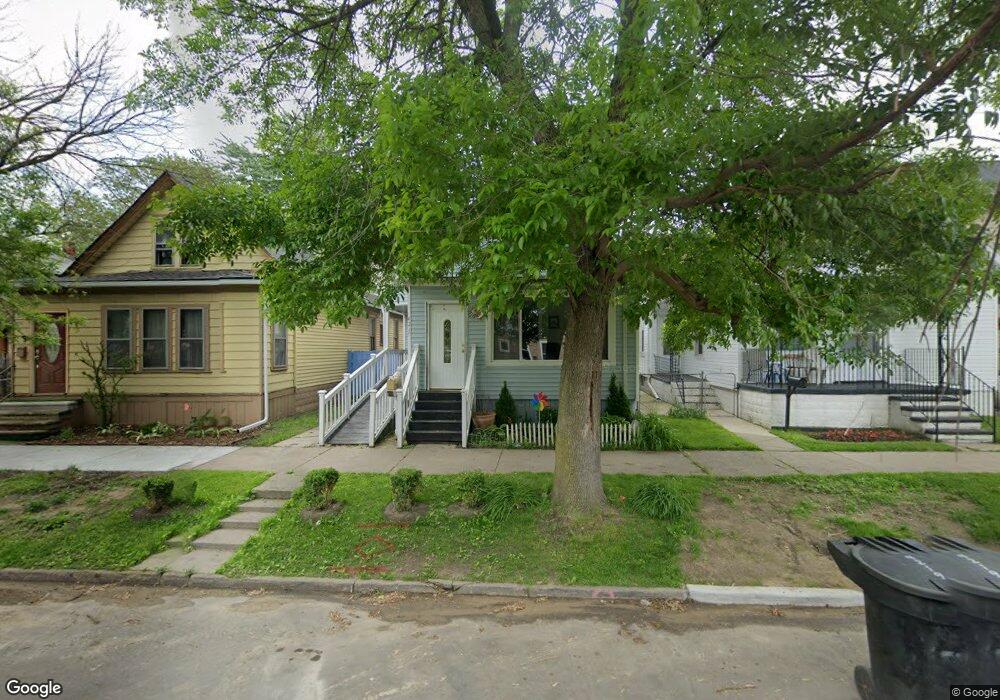
4219 Brandon St Detroit, MI 48209
Southwest Detroit NeighborhoodEstimated Value: $103,000 - $174,000
3
Beds
1
Bath
1,006
Sq Ft
$137/Sq Ft
Est. Value
About This Home
This home is located at 4219 Brandon St, Detroit, MI 48209 and is currently estimated at $137,344, approximately $136 per square foot. 4219 Brandon St is a home located in Wayne County with nearby schools including Maybury Elementary School, Charles L. Spain Elementary-Middle School, and Edward 'Duke' Ellington Conservatory of Music and Art.
Ownership History
Date
Name
Owned For
Owner Type
Purchase Details
Closed on
Feb 13, 2015
Sold by
Caty S Casas Llc
Bought by
Pantoja Zarate Manuel and Rosales De Pantoja Maricela
Current Estimated Value
Purchase Details
Closed on
Nov 11, 2014
Sold by
Treasurer Of The Charter County Of Wayne
Bought by
Catys Casas Llc
Purchase Details
Closed on
May 6, 2010
Sold by
Innovative Property Solution Inc
Bought by
Landeros Javier Lomeli and Sanchez Norma Medina
Purchase Details
Closed on
Oct 31, 2008
Sold by
Innovative Property Solutions Inc
Bought by
Landerson Javier Lomeli
Purchase Details
Closed on
Aug 7, 2008
Sold by
Campos Mario and Rodriguez Rocio
Bought by
Deutsche Bank National Trust Co and Novastar Mortgage Funding Trust Series 2
Purchase Details
Closed on
Mar 7, 2003
Sold by
Gonzalez Lydia E
Bought by
Rodriguez Rocio
Purchase Details
Closed on
Feb 27, 2001
Sold by
Soto Luis A
Bought by
Gonzalez Lydia E
Create a Home Valuation Report for This Property
The Home Valuation Report is an in-depth analysis detailing your home's value as well as a comparison with similar homes in the area
Home Values in the Area
Average Home Value in this Area
Purchase History
| Date | Buyer | Sale Price | Title Company |
|---|---|---|---|
| Pantoja Zarate Manuel | -- | None Available | |
| Catys Casas Llc | $5,500 | None Available | |
| Landeros Javier Lomeli | -- | None Available | |
| Landerson Javier Lomeli | -- | None Available | |
| Deutsche Bank National Trust Co | $9,350 | None Available | |
| Rodriguez Rocio | -- | -- | |
| Gonzalez Lydia E | -- | -- |
Source: Public Records
Tax History Compared to Growth
Tax History
| Year | Tax Paid | Tax Assessment Tax Assessment Total Assessment is a certain percentage of the fair market value that is determined by local assessors to be the total taxable value of land and additions on the property. | Land | Improvement |
|---|---|---|---|---|
| 2025 | $722 | $42,200 | $0 | $0 |
| 2024 | $722 | $34,700 | $0 | $0 |
| 2023 | $699 | $26,800 | $0 | $0 |
| 2022 | $753 | $21,000 | $0 | $0 |
| 2021 | $738 | $14,700 | $0 | $0 |
| 2020 | $731 | $16,600 | $0 | $0 |
| 2019 | $722 | $12,600 | $0 | $0 |
| 2018 | $634 | $9,500 | $0 | $0 |
| 2017 | $124 | $8,400 | $0 | $0 |
| 2016 | $700 | $14,300 | $0 | $0 |
| 2015 | $680 | $6,800 | $0 | $0 |
| 2013 | $750 | $7,496 | $0 | $0 |
| 2010 | -- | $10,740 | $394 | $10,346 |
Source: Public Records
Map
Nearby Homes
- 2012 Hubbard St
- 1965 Vinewood St
- 735 Hubbard St
- 744 W Grand Blvd
- 817 W Grand Blvd
- 1454 24th St
- 3102 24th St
- 1937 Morrell St
- 3644 Bagley St
- 5627 Brandon St
- 1028 Lansing St
- 2770 25th St
- 1620 Morrell St
- 1401 Mc Kinstry St
- 3930 Michigan Ave
- 1408 Lansing St
- 1547 25th St
- 3553 Bagley St
- 3301 Vinewood St
- 3401 Michigan Ave
- 4225 Brandon St
- 4213 Brandon St
- 4231 Brandon St
- 4201 Brandon St
- 4237 Brandon St
- 4243 Brandon St
- 4238 Toledo St
- 4220 Toledo St
- 4214 Toledo St
- 4249 Brandon St
- 4232 Toledo St
- 4206 Toledo St
- 4255 Brandon St
- 2324 Scotten St
- 4244 Toledo St
- 2318 Scotten St
- 4218 Brandon St
- 4224 Brandon St
- 4212 Brandon St
- 4250 Toledo St