4219 Maple St Omaha, NE 68111
Clifton Hills NeighborhoodEstimated Value: $64,000 - $92,000
2
Beds
3
Baths
1,440
Sq Ft
$51/Sq Ft
Est. Value
About This Home
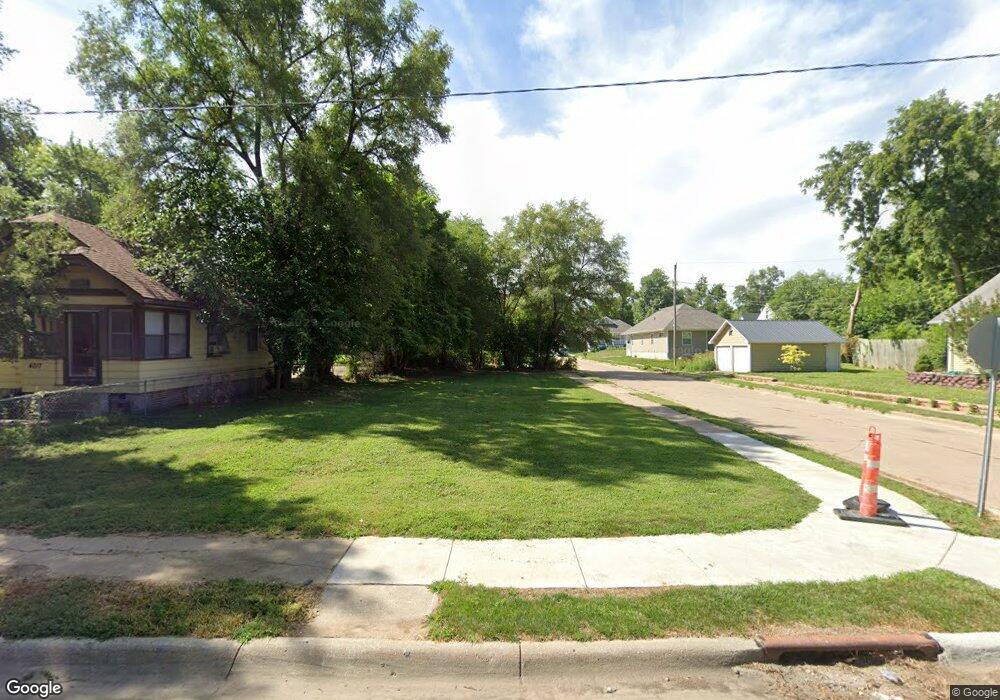
This home is located at 4219 Maple St, Omaha, NE 68111 and is currently estimated at $73,384, approximately $50 per square foot. 4219 Maple St is a home located in Douglas County with nearby schools including King Elementary School, Monroe Middle School, and Benson Magnet High School.
Ownership History
Date
Name
Owned For
Owner Type
Purchase Details
Closed on
Sep 30, 2020
Sold by
Opmaha Municipal Alnd Bank
Bought by
C J & F F Service Llc
Current Estimated Value
Purchase Details
Closed on
Jan 7, 2020
Sold by
Nguyen William Boa
Bought by
Omaha Municipal Land Bank
Purchase Details
Closed on
Feb 11, 2003
Sold by
M & R Investments Inc
Bought by
Vu Quan
Home Financials for this Owner
Home Financials are based on the most recent Mortgage that was taken out on this home.
Original Mortgage
$25,175
Interest Rate
5.83%
Mortgage Type
Unknown
Create a Home Valuation Report for This Property
The Home Valuation Report is an in-depth analysis detailing your home's value as well as a comparison with similar homes in the area
Home Values in the Area
Average Home Value in this Area
Purchase History
| Date | Buyer | Sale Price | Title Company |
|---|---|---|---|
| C J & F F Service Llc | -- | None Available | |
| Omaha Municipal Land Bank | $41,149 | None Available | |
| Vu Quan | $27,000 | -- |
Source: Public Records
Mortgage History
| Date | Status | Borrower | Loan Amount |
|---|---|---|---|
| Previous Owner | Vu Quan | $25,175 |
Source: Public Records
Tax History
| Year | Tax Paid | Tax Assessment Tax Assessment Total Assessment is a certain percentage of the fair market value that is determined by local assessors to be the total taxable value of land and additions on the property. | Land | Improvement |
|---|---|---|---|---|
| 2025 | $178 | $11,000 | $11,000 | -- |
| 2024 | $232 | $11,000 | $11,000 | -- |
| 2023 | $232 | $11,000 | $11,000 | -- |
| 2022 | $235 | $11,000 | $11,000 | $0 |
| 2021 | $233 | $11,000 | $11,000 | $0 |
| 2020 | $236 | $11,000 | $11,000 | $0 |
| 2019 | $15 | $700 | $700 | $0 |
| 2018 | $15 | $700 | $700 | $0 |
| 2017 | $13 | $700 | $700 | $0 |
| 2016 | $13 | $600 | $600 | $0 |
| 2015 | $93 | $1,700 | $1,700 | $0 |
| 2014 | $93 | $4,400 | $1,700 | $2,700 |
Source: Public Records
Map
Nearby Homes
Your Personal Tour Guide
Ask me questions while you tour the home.