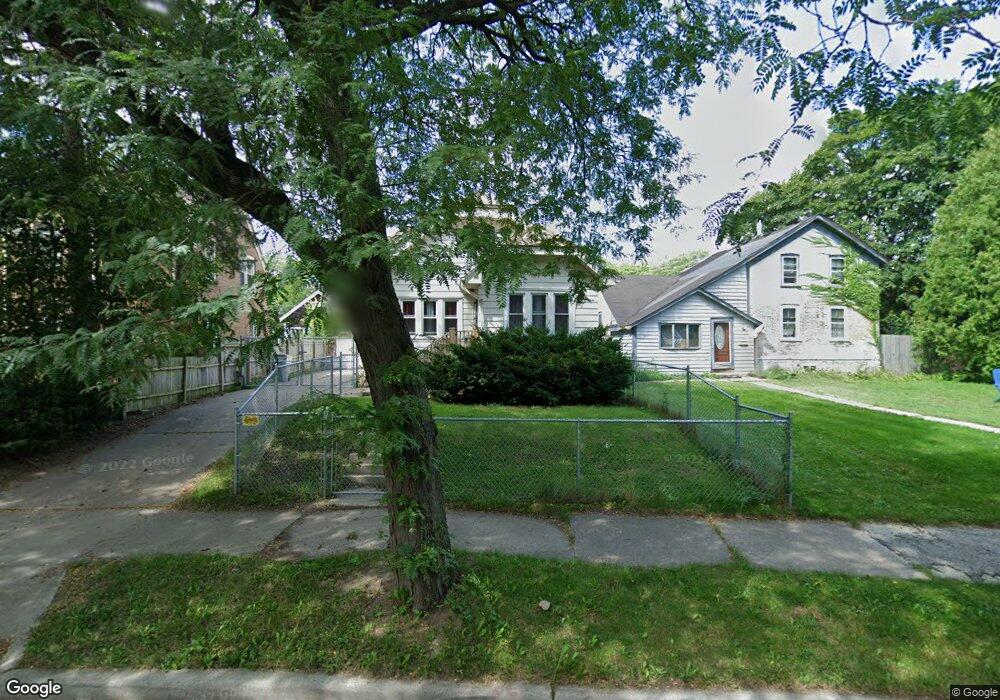
4219 N 39th St Milwaukee, WI 53216
Lincoln Creek NeighborhoodEstimated Value: $142,000 - $171,000
3
Beds
2
Baths
2,150
Sq Ft
$73/Sq Ft
Est. Value
About This Home
This home is located at 4219 N 39th St, Milwaukee, WI 53216 and is currently estimated at $157,479, approximately $73 per square foot. 4219 N 39th St is a home located in Milwaukee County with nearby schools including Clemens Elementary School, Craig Montessori School, and Milwaukee German Immersion School.
Ownership History
Date
Name
Owned For
Owner Type
Purchase Details
Closed on
Jun 20, 2011
Sold by
Federal National Mortgage Association
Bought by
Jackson Anita J
Current Estimated Value
Purchase Details
Closed on
Oct 13, 2010
Sold by
Jones Daniel F
Bought by
Federal National Mortgage Association
Purchase Details
Closed on
Jan 5, 2001
Sold by
Jones Abraham and Jones Abraham J
Bought by
Jones Daniel F
Home Financials for this Owner
Home Financials are based on the most recent Mortgage that was taken out on this home.
Original Mortgage
$68,385
Interest Rate
7.22%
Mortgage Type
Purchase Money Mortgage
Purchase Details
Closed on
Jul 26, 1996
Sold by
Mageski Debbie J
Bought by
Jones Abraham
Home Financials for this Owner
Home Financials are based on the most recent Mortgage that was taken out on this home.
Original Mortgage
$36,100
Interest Rate
7.87%
Mortgage Type
Purchase Money Mortgage
Create a Home Valuation Report for This Property
The Home Valuation Report is an in-depth analysis detailing your home's value as well as a comparison with similar homes in the area
Home Values in the Area
Average Home Value in this Area
Purchase History
| Date | Buyer | Sale Price | Title Company |
|---|---|---|---|
| Jackson Anita J | -- | None Available | |
| Federal National Mortgage Association | $134,983 | None Available | |
| Jones Daniel F | $70,500 | -- | |
| Jones Abraham | $38,000 | -- |
Source: Public Records
Mortgage History
| Date | Status | Borrower | Loan Amount |
|---|---|---|---|
| Previous Owner | Jones Daniel F | $68,385 | |
| Previous Owner | Jones Abraham | $36,100 |
Source: Public Records
Tax History Compared to Growth
Tax History
| Year | Tax Paid | Tax Assessment Tax Assessment Total Assessment is a certain percentage of the fair market value that is determined by local assessors to be the total taxable value of land and additions on the property. | Land | Improvement |
|---|---|---|---|---|
| 2024 | $2,331 | $115,900 | $3,200 | $112,700 |
| 2023 | $2,186 | $92,500 | $3,200 | $89,300 |
| 2022 | $1,928 | $92,500 | $3,200 | $89,300 |
| 2021 | $1,742 | $78,300 | $3,200 | $75,100 |
| 2020 | $1,790 | $78,300 | $3,200 | $75,100 |
| 2019 | $1,597 | $61,400 | $3,300 | $58,100 |
| 2018 | $1,664 | $61,400 | $3,300 | $58,100 |
| 2017 | $1,473 | $61,400 | $4,800 | $56,600 |
| 2016 | $1,747 | $63,500 | $4,800 | $58,700 |
| 2015 | $1,783 | $63,500 | $4,800 | $58,700 |
| 2014 | $1,823 | $63,500 | $4,800 | $58,700 |
| 2013 | -- | $66,800 | $4,800 | $62,000 |
Source: Public Records
Map
Nearby Homes
- 4265 N 39th St
- 4346 N 42nd Place
- 4047 N 38th St Unit 4049
- 4435 N 40th St
- 4440 N 41st St
- 4049 N Elmhurst Rd Unit 4051
- 3838 W Capitol Dr
- 4423 N 36th St
- 4006 N 41st St Unit 4008
- 4520 N 41st St
- 3625 W Capitol Dr
- 4513 N 37th St
- 4044 N 44th St
- 4466 W Hope Ave
- 3925 N 40th St Unit 3927
- 4024 N 44th St
- 3947 N 42nd St
- 4571 N 39th St
- 4576 N 40th St
- 4572 N 38th St
- 4215 N 39th St
- 4225 N 39th St
- 4207 N 39th St
- 4207 N 39th St Unit 4207A
- 4218 N 40th St
- 4226 N 40th St
- 4214 N 40th St
- 4232 N 40th St
- 4208 N 40th St
- 4203 N 39th St
- 4218 N 39th St
- 4243 N 39th St
- 3834 W Hope Ave
- 4228 N 39th St Unit 4230
- 4238 N 40th St
- 4249 N 39th St
- 4244 N 40th St
- 3828 W Hope Ave
- 4240 N Sercombe Rd Unit 4242
- 4177 N 39th St