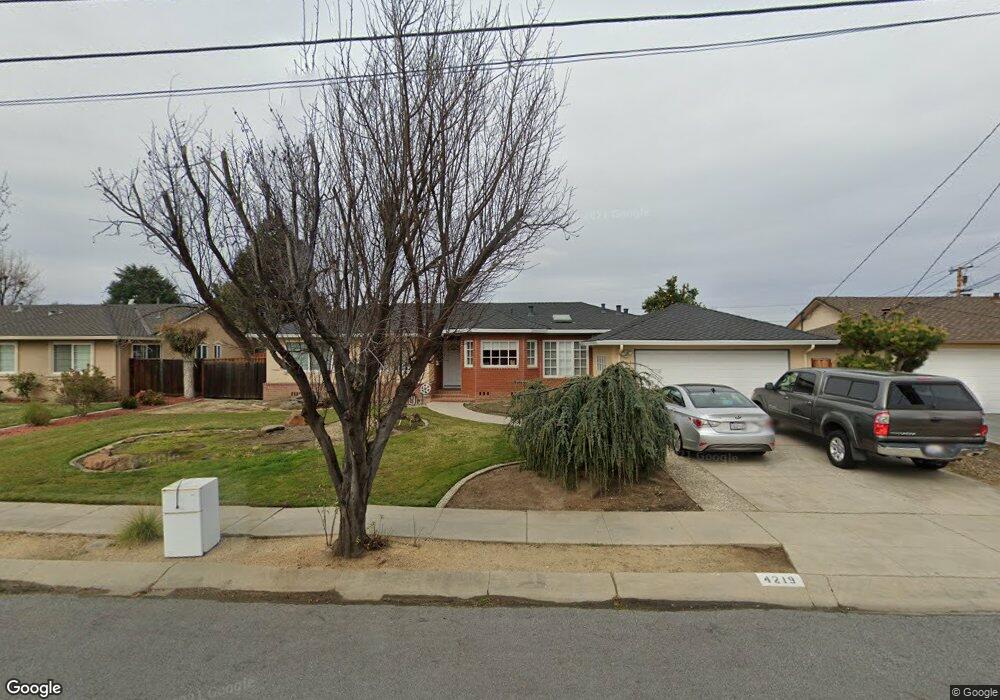
4219 Norris Rd Fremont, CA 94536
Glenmoor NeighborhoodEstimated Value: $1,846,051 - $2,298,000
3
Beds
3
Baths
1,955
Sq Ft
$1,053/Sq Ft
Est. Value
About This Home
This home is located at 4219 Norris Rd, Fremont, CA 94536 and is currently estimated at $2,059,013, approximately $1,053 per square foot. 4219 Norris Rd is a home located in Alameda County with nearby schools including Glenmoor Elementary School, Centerville Junior High School, and Washington High School.
Ownership History
Date
Name
Owned For
Owner Type
Purchase Details
Closed on
Jul 2, 2002
Sold by
Alarcon Mario and Alarcon Maria L
Bought by
Woo Young K and Woo Un Yong
Current Estimated Value
Home Financials for this Owner
Home Financials are based on the most recent Mortgage that was taken out on this home.
Original Mortgage
$613,600
Outstanding Balance
$260,117
Interest Rate
6.71%
Estimated Equity
$1,798,896
Purchase Details
Closed on
Mar 25, 1997
Sold by
Mall Athel
Bought by
Ambrose John
Home Financials for this Owner
Home Financials are based on the most recent Mortgage that was taken out on this home.
Original Mortgage
$292,000
Interest Rate
7.63%
Purchase Details
Closed on
Sep 10, 1996
Sold by
Kendrick Jonathan and Kendrick Evelyn
Bought by
Ambrose John
Create a Home Valuation Report for This Property
The Home Valuation Report is an in-depth analysis detailing your home's value as well as a comparison with similar homes in the area
Home Values in the Area
Average Home Value in this Area
Purchase History
| Date | Buyer | Sale Price | Title Company |
|---|---|---|---|
| Woo Young K | $767,000 | American Title Co | |
| Ambrose John | -- | Old Republic Title Company | |
| Alarcon Mario | $365,000 | Old Republic Title Company | |
| Ambrose John | $260,001 | -- |
Source: Public Records
Mortgage History
| Date | Status | Borrower | Loan Amount |
|---|---|---|---|
| Open | Woo Young K | $613,600 | |
| Previous Owner | Alarcon Mario | $292,000 | |
| Closed | Alarcon Mario | $36,500 |
Source: Public Records
Tax History Compared to Growth
Tax History
| Year | Tax Paid | Tax Assessment Tax Assessment Total Assessment is a certain percentage of the fair market value that is determined by local assessors to be the total taxable value of land and additions on the property. | Land | Improvement |
|---|---|---|---|---|
| 2025 | $13,157 | $1,110,768 | $333,230 | $777,538 |
| 2024 | $13,157 | $1,088,993 | $326,698 | $762,295 |
| 2023 | $12,812 | $1,067,648 | $320,294 | $747,354 |
| 2022 | $12,658 | $1,046,717 | $314,015 | $732,702 |
| 2021 | $12,346 | $1,026,198 | $307,859 | $718,339 |
| 2020 | $12,415 | $1,015,684 | $304,705 | $710,979 |
| 2019 | $12,272 | $995,772 | $298,731 | $697,041 |
| 2018 | $12,035 | $976,252 | $292,875 | $683,377 |
| 2017 | $11,735 | $957,115 | $287,134 | $669,981 |
| 2016 | $11,542 | $938,354 | $281,506 | $656,848 |
| 2015 | $11,395 | $924,264 | $277,279 | $646,985 |
| 2014 | $11,204 | $906,164 | $271,849 | $634,315 |
Source: Public Records
Map
Nearby Homes
- 38265 Corrigan Ct
- 3810 Burton Common
- 3833 Burton Common
- 4328 Cognina Ct
- Plan 1629 at Veranda
- Plan 1165 at Veranda
- Plan 1670 at Veranda
- Plan 1455 at Veranda
- Plan 1394 at Veranda
- Plan 1725 at Veranda
- Plan 1378 at Veranda
- Plan 1657 at Veranda
- 4586 Norris Rd
- 38030 Dundee Common
- 37621 Glenmoor Dr
- 37637 Canterbury St
- 4237 Garland Dr
- 4715 Eggers Dr
- 3507 Buttonwood Terrace Unit 203
- 38837 Fremont Blvd
- 4153 Norris Rd
- 4235 Norris Rd
- 4218 Lombard Ave
- 4236 Lombard Ave
- 4154 Lombard Ave
- 37946 Palmer Dr
- 4137 Norris Rd
- 4216 Norris Rd
- 4232 Norris Rd
- 4150 Norris Rd
- 37930 Palmer Dr
- 4138 Lombard Ave
- 4248 Norris Rd
- 4134 Norris Rd
- 4121 Norris Rd
- 4217 Lombard Ave
- 37880 Palmer Dr
- 4201 Mattos Dr
- 4122 Lombard Ave
- 4157 Lombard Ave