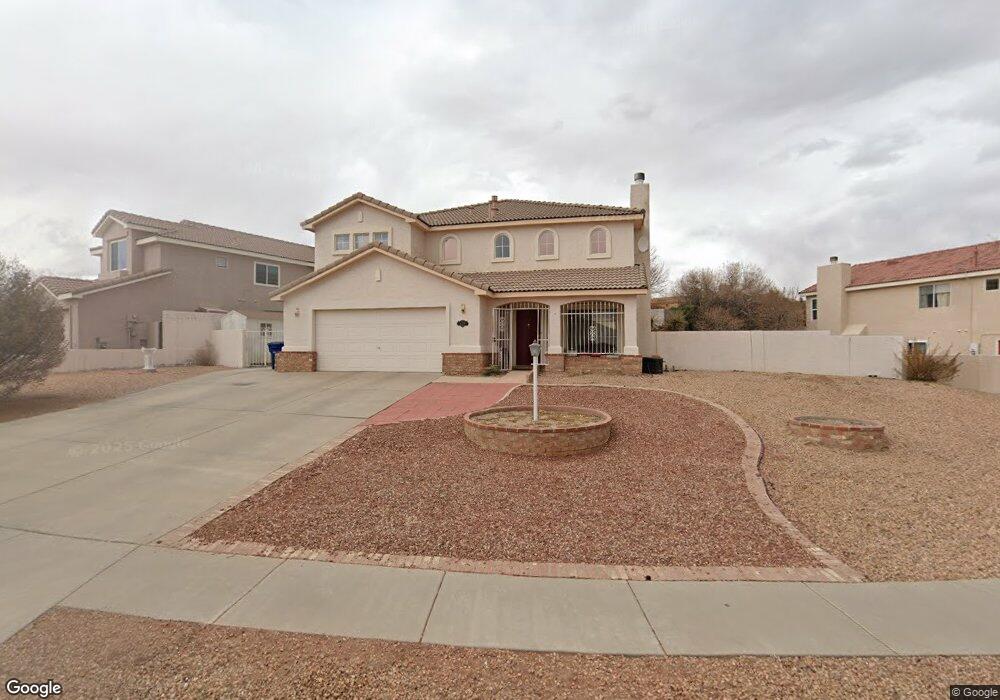
4219 Skyview Crest Rd NW Albuquerque, NM 87114
Seven Bar North NeighborhoodEstimated Value: $384,000 - $470,000
4
Beds
4
Baths
2,242
Sq Ft
$192/Sq Ft
Est. Value
About This Home
This home is located at 4219 Skyview Crest Rd NW, Albuquerque, NM 87114 and is currently estimated at $431,402, approximately $192 per square foot. 4219 Skyview Crest Rd NW is a home located in Bernalillo County with nearby schools including Seven Bar Elementary School, James Monroe Middle School, and Cibola High School.
Ownership History
Date
Name
Owned For
Owner Type
Purchase Details
Closed on
Oct 27, 2012
Sold by
Junchaya Miguel A and Junchaya Carolyn
Bought by
Junchaya Kellye A
Current Estimated Value
Purchase Details
Closed on
Jul 8, 2002
Sold by
Aragon Jose D and Aragon Brenda S
Bought by
Junchaya Miguel A and Junchaya Kellye A
Home Financials for this Owner
Home Financials are based on the most recent Mortgage that was taken out on this home.
Original Mortgage
$154,800
Outstanding Balance
$65,314
Interest Rate
6.78%
Estimated Equity
$366,088
Purchase Details
Closed on
Nov 30, 1999
Sold by
Bayer Virginia V
Bought by
Aragon Jose D and Aragon Brenda S
Home Financials for this Owner
Home Financials are based on the most recent Mortgage that was taken out on this home.
Original Mortgage
$148,000
Interest Rate
7.93%
Create a Home Valuation Report for This Property
The Home Valuation Report is an in-depth analysis detailing your home's value as well as a comparison with similar homes in the area
Home Values in the Area
Average Home Value in this Area
Purchase History
| Date | Buyer | Sale Price | Title Company |
|---|---|---|---|
| Junchaya Kellye A | -- | Rio Grande Title Co Inc | |
| Junchaya Miguel A | -- | First American Title Ins Co | |
| Aragon Jose D | -- | Rio Grande Title Company Inc |
Source: Public Records
Mortgage History
| Date | Status | Borrower | Loan Amount |
|---|---|---|---|
| Open | Junchaya Miguel A | $154,800 | |
| Previous Owner | Aragon Jose D | $148,000 | |
| Closed | Aragon Jose D | $38,000 | |
| Closed | Junchaya Miguel A | $19,350 |
Source: Public Records
Tax History Compared to Growth
Tax History
| Year | Tax Paid | Tax Assessment Tax Assessment Total Assessment is a certain percentage of the fair market value that is determined by local assessors to be the total taxable value of land and additions on the property. | Land | Improvement |
|---|---|---|---|---|
| 2025 | $3,244 | $81,252 | $19,663 | $61,589 |
| 2024 | $3,244 | $78,885 | $19,090 | $59,795 |
| 2023 | $3,187 | $76,587 | $18,534 | $58,053 |
| 2022 | $3,078 | $74,357 | $17,995 | $56,362 |
| 2021 | $2,972 | $72,192 | $17,471 | $54,721 |
| 2020 | $2,921 | $70,089 | $16,962 | $53,127 |
| 2019 | $2,832 | $68,048 | $16,468 | $51,580 |
| 2018 | $2,729 | $68,048 | $16,468 | $51,580 |
| 2017 | $2,643 | $66,066 | $15,988 | $50,078 |
| 2016 | $2,564 | $62,275 | $15,071 | $47,204 |
| 2015 | $60,461 | $60,461 | $14,632 | $45,829 |
| 2014 | $2,502 | $60,927 | $14,632 | $46,295 |
| 2013 | -- | $60,927 | $14,632 | $46,295 |
Source: Public Records
Map
Nearby Homes
- 10723 Miera Dr NW
- 4324 Dry Creek Place NW
- 4104 Killington Rd NW
- 10729 Pueblo Place NW
- 0 Olympic Place NW Unit 1068259
- 4016 Rayado Place NW
- 4001 Cresta Park Ave NW
- 10516 Calle Sombra NW
- 10904 Snowbird Dr NW
- 4505 Driftwood Ave NW
- 10912 Snowbird Dr NW
- 10756 Galaxia Park Dr NW
- 4824 Driftwood Ave NW
- 4504 Topaz Ave NW
- 4115 Arapahoe Ave NW
- 4509 Tottle Ave NW
- 4004 Arapahoe Ave NW
- 4015 Arapahoe Ave NW
- 10613 Easy St NW
- 3217 23rd Ave SW
- 4223 Skyview Crest Rd NW
- 4220 Montera Place NW
- 4215 Skyview Crest Rd NW
- 4216 Montera Place NW
- 4214 Skyview Crest Rd NW
- 4209 Skyview Crest Rd NW
- 4220 Skyview Crest Rd NW
- 4218 Skyview Crest Rd NW
- 4216 Skyview Crest Rd NW
- 4222 Skyview Crest Rd NW
- 4212 Montera Place NW
- 4212 Skyview Crest Rd NW
- 4217 Montera Place NW
- 4221 Montera Place NW
- 4225 Montera Place NW
- 4208 Skyview Crest Rd NW
- 10805 Sandcreek St NW
- 4240 Montera Place NW
- 4215 Montera Place NW
- 10809 Sandcreek St NW