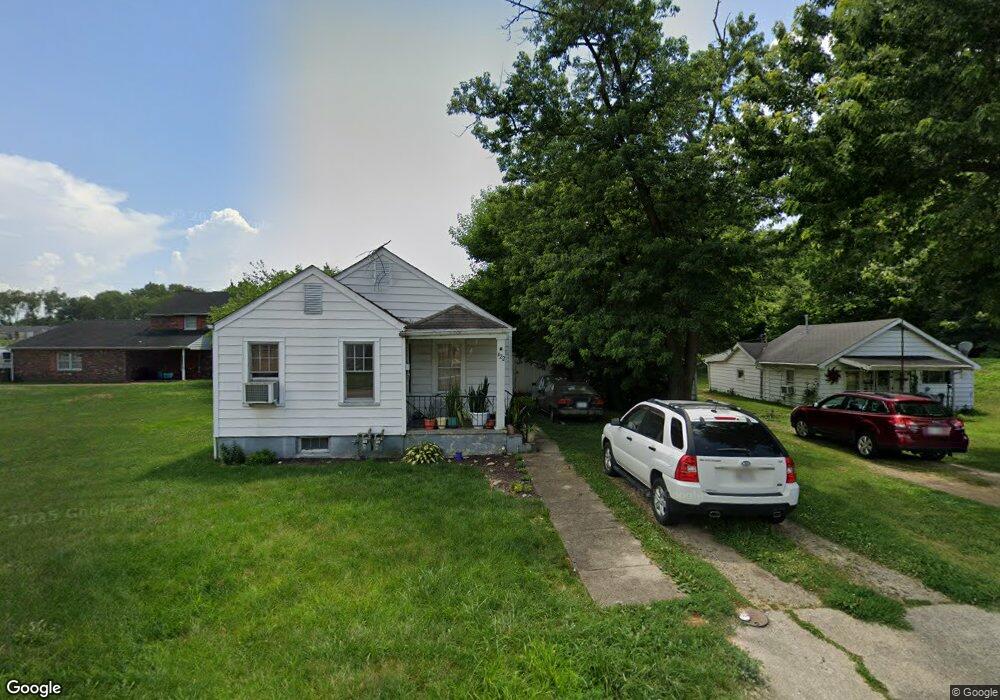
422 1/2 Forest Ave Franklin, OH 45005
Estimated Value: $89,854 - $179,000
1
Bed
1
Bath
642
Sq Ft
$207/Sq Ft
Est. Value
About This Home
This home is located at 422 1/2 Forest Ave, Franklin, OH 45005 and is currently estimated at $132,714, approximately $206 per square foot. 422 1/2 Forest Ave is a home located in Warren County with nearby schools including Franklin High School.
Ownership History
Date
Name
Owned For
Owner Type
Purchase Details
Closed on
Apr 5, 2010
Sold by
Ransom Sherri and Case #09Cv74948
Bought by
Leach Jason T and Leach Melissa G
Current Estimated Value
Purchase Details
Closed on
Jun 28, 2007
Sold by
Fultz Robin E and Fultz Lee Ann
Bought by
Ransom Sherri
Home Financials for this Owner
Home Financials are based on the most recent Mortgage that was taken out on this home.
Original Mortgage
$75,000
Interest Rate
6.54%
Mortgage Type
Purchase Money Mortgage
Purchase Details
Closed on
Jul 15, 2005
Sold by
Lamb Leroy and Lamb Teri
Bought by
Fultz Robin E
Home Financials for this Owner
Home Financials are based on the most recent Mortgage that was taken out on this home.
Original Mortgage
$112,000
Interest Rate
8.75%
Mortgage Type
Fannie Mae Freddie Mac
Purchase Details
Closed on
Aug 27, 2002
Sold by
Lonicker Clarence
Bought by
Lamb Leroy and Lamb Teri
Purchase Details
Closed on
Oct 2, 1979
Sold by
Carlson Carlson and Carlson Wm O
Create a Home Valuation Report for This Property
The Home Valuation Report is an in-depth analysis detailing your home's value as well as a comparison with similar homes in the area
Home Values in the Area
Average Home Value in this Area
Purchase History
| Date | Buyer | Sale Price | Title Company |
|---|---|---|---|
| Leach Jason T | $55,000 | None Available | |
| Ransom Sherri | -- | Overbrook Title Services | |
| Fultz Robin E | $112,000 | Stewart Advanced Land Title | |
| Lamb Leroy | $110,000 | -- | |
| -- | $11,500 | -- |
Source: Public Records
Mortgage History
| Date | Status | Borrower | Loan Amount |
|---|---|---|---|
| Previous Owner | Ransom Sherri | $75,000 | |
| Previous Owner | Fultz Robin E | $112,000 |
Source: Public Records
Tax History Compared to Growth
Tax History
| Year | Tax Paid | Tax Assessment Tax Assessment Total Assessment is a certain percentage of the fair market value that is determined by local assessors to be the total taxable value of land and additions on the property. | Land | Improvement |
|---|---|---|---|---|
| 2024 | $937 | $17,080 | $1,660 | $15,420 |
| 2023 | $790 | $13,660 | $1,099 | $12,561 |
| 2022 | $776 | $13,661 | $1,099 | $12,562 |
| 2021 | $738 | $13,661 | $1,099 | $12,562 |
| 2020 | $675 | $10,927 | $879 | $10,049 |
| 2019 | $620 | $10,927 | $879 | $10,049 |
| 2018 | $555 | $10,927 | $879 | $10,049 |
| 2017 | $657 | $10,644 | $872 | $9,772 |
| 2016 | $669 | $10,644 | $872 | $9,772 |
| 2015 | $669 | $10,644 | $872 | $9,772 |
| 2014 | $685 | $10,640 | $870 | $9,770 |
| 2013 | $534 | $11,920 | $980 | $10,940 |
Source: Public Records
Map
Nearby Homes
- 1504 Knightsbridge Ct
- 105 Chestnut St Unit 1
- 605 Spring Ave
- 0 E 4th St
- 627 S River St
- 521 S Main St
- 631 S River St
- 233 S Main St
- 235 S Main St
- 213 Locust St
- 519 Anderson St
- 315 Bridge St
- 1200 Riley Blvd
- 820 S River St
- 121 E 5th St
- 102 Warren Ave
- 0 Victoria Dr Unit 1852824
- 0 Victoria Dr Unit 942075
- 7 Highland St
- 1010 S Main St