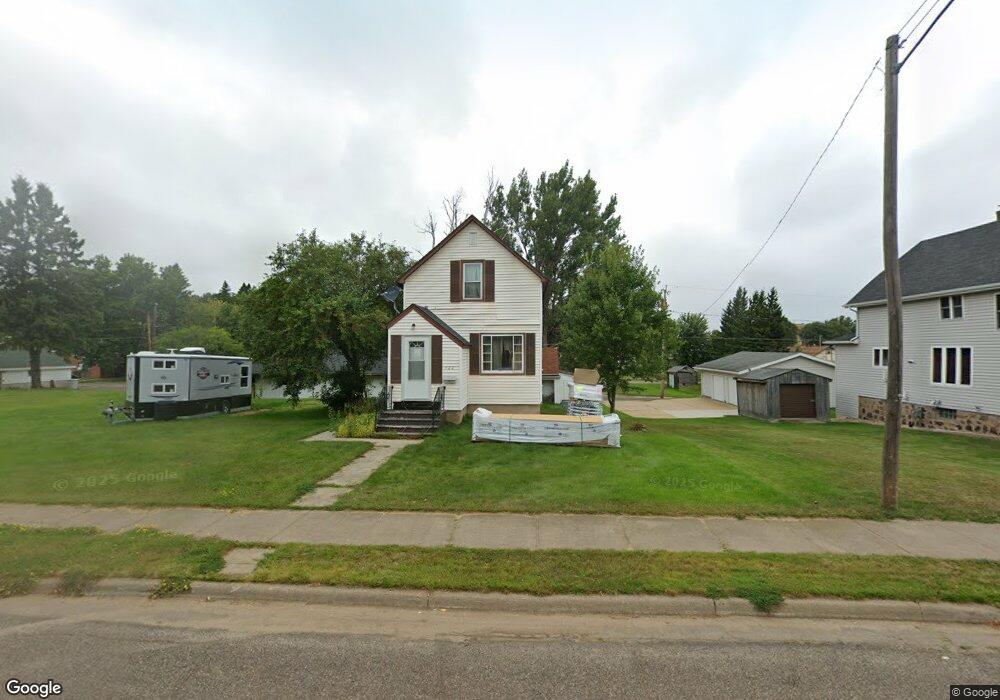
422 3rd St SW Chisholm, MN 55719
Estimated Value: $111,000 - $130,000
2
Beds
2
Baths
756
Sq Ft
$161/Sq Ft
Est. Value
About This Home
This home is located at 422 3rd St SW, Chisholm, MN 55719 and is currently estimated at $121,713, approximately $160 per square foot. 422 3rd St SW is a home located in St. Louis County with nearby schools including Vaughan Elementary School, Chisholm Elementary School, and Chisholm Secondary School.
Ownership History
Date
Name
Owned For
Owner Type
Purchase Details
Closed on
Nov 5, 2021
Sold by
Graff Chad and Graff Stephanie
Bought by
Reini Daniel A
Current Estimated Value
Home Financials for this Owner
Home Financials are based on the most recent Mortgage that was taken out on this home.
Original Mortgage
$98,181
Outstanding Balance
$89,777
Interest Rate
2.99%
Mortgage Type
New Conventional
Estimated Equity
$31,936
Purchase Details
Closed on
Oct 1, 2018
Sold by
Gargano George J and Gargano Casey L
Bought by
Graff Chad
Home Financials for this Owner
Home Financials are based on the most recent Mortgage that was taken out on this home.
Original Mortgage
$70,707
Interest Rate
4.5%
Mortgage Type
New Conventional
Purchase Details
Closed on
Sep 21, 2011
Sold by
Gargano George J and Gargano Casey L
Bought by
Gargano George J and Gargano Casey L
Create a Home Valuation Report for This Property
The Home Valuation Report is an in-depth analysis detailing your home's value as well as a comparison with similar homes in the area
Home Values in the Area
Average Home Value in this Area
Purchase History
| Date | Buyer | Sale Price | Title Company |
|---|---|---|---|
| Reini Daniel A | $97,200 | All American Title Company | |
| Graff Chad | $69,000 | Sellman Title Company Llc | |
| Gargano George J | -- | None Available |
Source: Public Records
Mortgage History
| Date | Status | Borrower | Loan Amount |
|---|---|---|---|
| Open | Reini Daniel A | $98,181 | |
| Previous Owner | Graff Chad | $70,707 |
Source: Public Records
Tax History
| Year | Tax Paid | Tax Assessment Tax Assessment Total Assessment is a certain percentage of the fair market value that is determined by local assessors to be the total taxable value of land and additions on the property. | Land | Improvement |
|---|---|---|---|---|
| 2024 | $658 | $96,300 | $9,500 | $86,800 |
| 2023 | $658 | $91,400 | $9,500 | $81,900 |
| 2022 | $306 | $70,700 | $7,300 | $63,400 |
| 2021 | $218 | $56,300 | $4,100 | $52,200 |
| 2020 | $188 | $44,600 | $4,100 | $40,500 |
| 2019 | $166 | $44,600 | $4,100 | $40,500 |
| 2018 | $154 | $41,800 | $4,100 | $37,700 |
| 2017 | $212 | $41,800 | $4,100 | $37,700 |
| 2016 | $234 | $48,800 | $9,100 | $39,700 |
| 2015 | $239 | $29,300 | $5,500 | $23,800 |
| 2014 | $239 | $26,300 | $5,500 | $20,800 |
Source: Public Records
Map
Nearby Homes
Your Personal Tour Guide
Ask me questions while you tour the home.