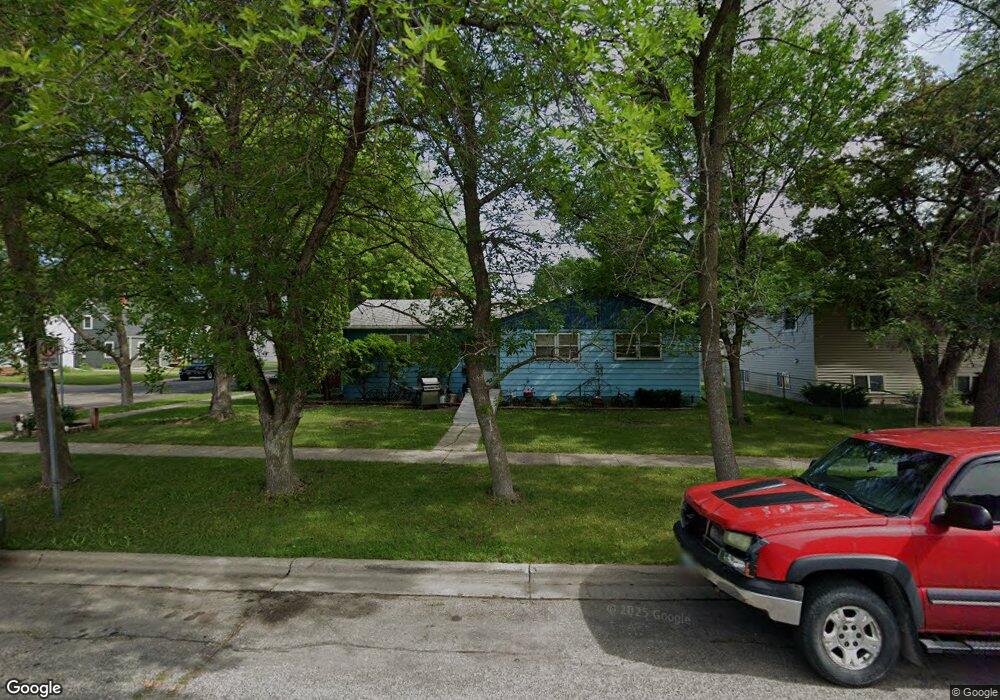
422 4th Ave W West Fargo, ND 58078
Francis NeighborhoodEstimated Value: $269,000
4
Beds
3
Baths
1,200
Sq Ft
$224/Sq Ft
Est. Value
About This Home
This home is located at 422 4th Ave W, West Fargo, ND 58078 and is currently estimated at $269,000, approximately $224 per square foot. 422 4th Ave W is a home located in Cass County with nearby schools including Westside Elementary School, Cheney Middle School, and West Fargo High School.
Create a Home Valuation Report for This Property
The Home Valuation Report is an in-depth analysis detailing your home's value as well as a comparison with similar homes in the area
Home Values in the Area
Average Home Value in this Area
Tax History Compared to Growth
Tax History
| Year | Tax Paid | Tax Assessment Tax Assessment Total Assessment is a certain percentage of the fair market value that is determined by local assessors to be the total taxable value of land and additions on the property. | Land | Improvement |
|---|---|---|---|---|
| 2024 | $2,817 | $122,000 | $17,500 | $104,500 |
| 2023 | $3,383 | $123,900 | $17,500 | $106,400 |
| 2022 | $3,266 | $114,250 | $17,500 | $96,750 |
| 2021 | $3,018 | $101,900 | $12,750 | $89,150 |
| 2020 | $2,964 | $102,950 | $12,750 | $90,200 |
| 2019 | $2,746 | $94,950 | $12,750 | $82,200 |
| 2018 | $2,657 | $96,000 | $12,750 | $83,250 |
| 2017 | $2,530 | $92,800 | $12,750 | $80,050 |
| 2016 | $2,253 | $90,400 | $12,750 | $77,650 |
| 2015 | $1,844 | $66,950 | $8,500 | $58,450 |
| 2014 | $1,808 | $62,550 | $8,500 | $54,050 |
| 2013 | $1,836 | $62,550 | $8,500 | $54,050 |
Source: Public Records
Map
Nearby Homes
- 431 Morrison St
- 520 6th Ave W Unit 8
- 514 7th Ave W
- 719 5th Ave W
- 744 Elm St
- 109 7th Ave E
- 209 1st Ave E
- 226 10 1/2 Ave W
- 52 Pinewood Blvd
- 237 10th Ave E
- 426 3rd Ave E
- 78 Evergreen Cir
- 1165 7th Ave W
- 830 12th Ave W
- 243 12 1 2 Ave E
- 245 12th Ave E
- 437 10th Ave E
- 1447 Elmwood Ct
- 232 15th Ave W
- 336 13th Ave E
- 416 4th Ave W
- 317 Francis St
- 313 Francis St
- 320 Francis St
- 410 4th Ave W
- 401 Francis St
- 316 Francis St
- 307 Francis St
- 402 4th Ave W
- 314 Morrison St
- 312 Francis St
- 402 Francis St
- 308 Francis St
- 407 Francis St
- 402 Morrison St
- 301 Francis St
- 308 Morrison St
- 304 Francis St
- 412 Francis St
- 408 Morrison St