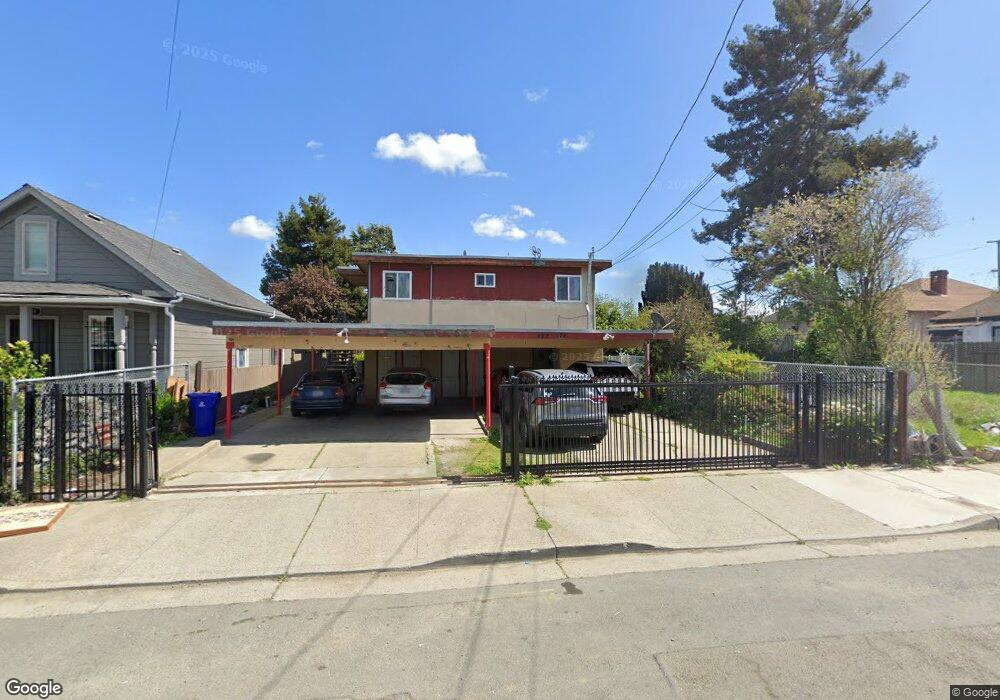
422 4th St Richmond, CA 94801
Iron Triangle NeighborhoodEstimated Value: $838,000 - $1,052,000
Studio
--
Bath
3,168
Sq Ft
$290/Sq Ft
Est. Value
About This Home
This home is located at 422 4th St, Richmond, CA 94801 and is currently estimated at $920,301, approximately $290 per square foot. 422 4th St is a home located in Contra Costa County with nearby schools including Lincoln Elementary School, Lovonya DeJean Middle School, and John F. Kennedy High School.
Ownership History
Date
Name
Owned For
Owner Type
Purchase Details
Closed on
Aug 3, 2005
Sold by
Villatoro Roxana
Bought by
Reyes Arquimides Villatoro
Current Estimated Value
Purchase Details
Closed on
May 16, 2005
Sold by
Ayala Daisy
Bought by
Ayala Juan Humberto
Home Financials for this Owner
Home Financials are based on the most recent Mortgage that was taken out on this home.
Original Mortgage
$450,000
Interest Rate
6.12%
Mortgage Type
Purchase Money Mortgage
Purchase Details
Closed on
Mar 26, 2004
Sold by
Hampton Donald L
Bought by
Ramos Mario and Hernandez Sandra
Home Financials for this Owner
Home Financials are based on the most recent Mortgage that was taken out on this home.
Original Mortgage
$407,200
Interest Rate
6.8%
Mortgage Type
Purchase Money Mortgage
Create a Home Valuation Report for This Property
The Home Valuation Report is an in-depth analysis detailing your home's value as well as a comparison with similar homes in the area
Home Values in the Area
Average Home Value in this Area
Purchase History
| Date | Buyer | Sale Price | Title Company |
|---|---|---|---|
| Reyes Arquimides Villatoro | -- | -- | |
| Barraza Carlos G | -- | -- | |
| Ayala Juan Humberto | -- | Commonwealth Title | |
| Barraza Carlos G | $600,000 | Commonwealth Title | |
| Ramos Mario | $509,000 | Commonwealth Title |
Source: Public Records
Mortgage History
| Date | Status | Borrower | Loan Amount |
|---|---|---|---|
| Previous Owner | Barraza Carlos G | $450,000 | |
| Previous Owner | Ramos Mario | $407,200 | |
| Closed | Ramos Mario | $50,900 |
Source: Public Records
Tax History
| Year | Tax Paid | Tax Assessment Tax Assessment Total Assessment is a certain percentage of the fair market value that is determined by local assessors to be the total taxable value of land and additions on the property. | Land | Improvement |
|---|---|---|---|---|
| 2025 | $16,895 | $849,111 | $281,512 | $567,599 |
| 2024 | $16,139 | $832,463 | $275,993 | $556,470 |
| 2023 | $16,139 | $816,141 | $270,582 | $545,559 |
| 2022 | $15,774 | $800,139 | $265,277 | $534,862 |
| 2021 | $14,601 | $720,000 | $240,000 | $480,000 |
| 2019 | $12,849 | $640,000 | $212,100 | $427,900 |
| 2018 | $11,428 | $560,000 | $185,600 | $374,400 |
| 2017 | $10,153 | $480,000 | $159,100 | $320,900 |
| 2016 | $10,090 | $480,000 | $159,100 | $320,900 |
| 2015 | $9,486 | $440,000 | $145,800 | $294,200 |
| 2014 | $8,022 | $340,000 | $112,700 | $227,300 |
Source: Public Records
Map
Nearby Homes
Your Personal Tour Guide
Ask me questions while you tour the home.