C
Seller's Agent in 2016
Christine Moore
Crescent Hill Real Estate
(978) 985-8455
15 Total Sales

Estimated Value: $266,000 - $312,000
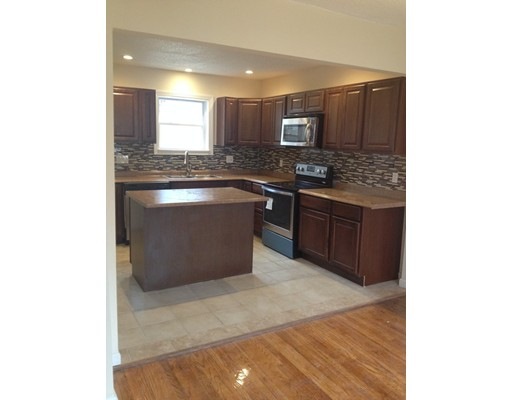
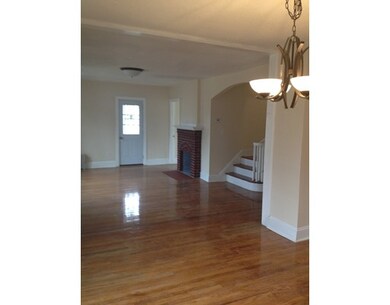
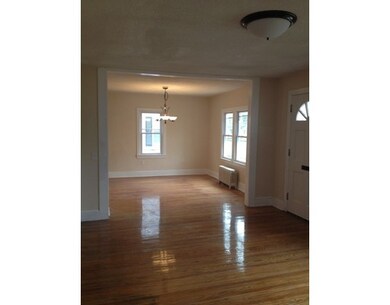
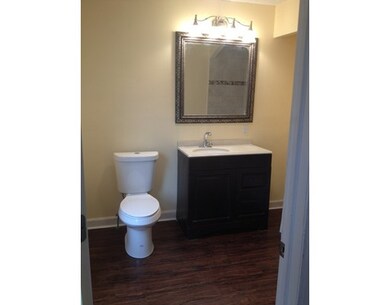
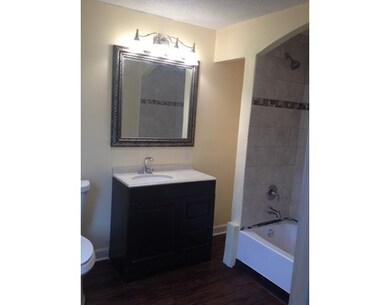
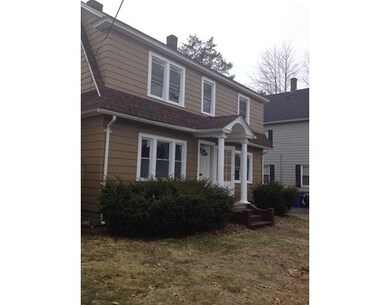
Corner Lot home features an open Concept Floorplan, an alarm system and many new updates including kitchen and baths and a new roof. This home has 4 good sized bedrooms and one smaller room that could be an office or a 5th bedroom for a child. Home includes a shed for extra storage.
Last Buyer's Agent
Tanya Vital-Basile
Executive Real Estate, Inc.

Home Type
Single Family
Est. Annual Taxes
$3,395
Year Built
1928
Lot Details
0
| Date | Buyer | Sale Price | Title Company |
|---|---|---|---|
| Rodriguez Kevin | $132,000 | -- | |
| Liberty Onyx Llc | $52,800 | -- |
| Date | Status | Borrower | Loan Amount |
|---|---|---|---|
| Open | Rodriguez Kevin | $129,609 | |
| Previous Owner | Liberty Onyx Llc | $86,000 |
| Date | Event | Price | Change | Sq Ft Price |
|---|---|---|---|---|
| 03/23/2016 03/23/16 | Sold | $132,000 | +0.2% | $86 / Sq Ft |
| 01/30/2016 01/30/16 | Pending | -- | -- | -- |
| 01/14/2016 01/14/16 | Price Changed | $131,700 | -0.1% | $86 / Sq Ft |
| 01/06/2016 01/06/16 | Price Changed | $131,800 | -0.1% | $86 / Sq Ft |
| 12/23/2015 12/23/15 | Price Changed | $131,900 | -0.2% | $86 / Sq Ft |
| 12/12/2015 12/12/15 | For Sale | $132,100 | 0.0% | $86 / Sq Ft |
| 12/04/2015 12/04/15 | Pending | -- | -- | -- |
| 11/25/2015 11/25/15 | Price Changed | $132,100 | -0.1% | $86 / Sq Ft |
| 11/19/2015 11/19/15 | Price Changed | $132,200 | -0.2% | $86 / Sq Ft |
| 11/10/2015 11/10/15 | Price Changed | $132,500 | -0.7% | $86 / Sq Ft |
| 11/08/2015 11/08/15 | Price Changed | $133,500 | -0.4% | $87 / Sq Ft |
| 10/30/2015 10/30/15 | Price Changed | $134,000 | +3.2% | $87 / Sq Ft |
| 10/13/2015 10/13/15 | Price Changed | $129,900 | -6.1% | $85 / Sq Ft |
| 10/11/2015 10/11/15 | Price Changed | $138,400 | -0.1% | $90 / Sq Ft |
| 09/25/2015 09/25/15 | Price Changed | $138,500 | -1.0% | $90 / Sq Ft |
| 08/24/2015 08/24/15 | Price Changed | $139,900 | -2.1% | $91 / Sq Ft |
| 08/20/2015 08/20/15 | Price Changed | $142,900 | -0.7% | $93 / Sq Ft |
| 08/17/2015 08/17/15 | Price Changed | $143,900 | -1.6% | $94 / Sq Ft |
| 08/12/2015 08/12/15 | Price Changed | $146,200 | -0.2% | $95 / Sq Ft |
| 08/07/2015 08/07/15 | Price Changed | $146,500 | -2.0% | $95 / Sq Ft |
| 08/03/2015 08/03/15 | Price Changed | $149,500 | -0.3% | $97 / Sq Ft |
| 07/22/2015 07/22/15 | For Sale | $149,900 | +183.9% | $98 / Sq Ft |
| 08/11/2014 08/11/14 | Pending | -- | -- | -- |
| 08/08/2014 08/08/14 | Sold | $52,800 | 0.0% | $34 / Sq Ft |
| 06/08/2014 06/08/14 | Off Market | $52,800 | -- | -- |
| 03/04/2014 03/04/14 | Price Changed | $78,000 | -2.5% | $51 / Sq Ft |
| 01/26/2014 01/26/14 | Price Changed | $80,000 | -5.9% | $52 / Sq Ft |
| 12/29/2013 12/29/13 | Price Changed | $85,000 | -5.6% | $55 / Sq Ft |
| 12/15/2013 12/15/13 | Price Changed | $90,000 | -5.3% | $59 / Sq Ft |
| 10/30/2013 10/30/13 | Price Changed | $95,000 | -4.0% | $62 / Sq Ft |
| 09/29/2013 09/29/13 | Price Changed | $99,000 | -9.2% | $64 / Sq Ft |
| 08/19/2013 08/19/13 | For Sale | $109,000 | -- | $71 / Sq Ft |
| Year | Tax Paid | Tax Assessment Tax Assessment Total Assessment is a certain percentage of the fair market value that is determined by local assessors to be the total taxable value of land and additions on the property. | Land | Improvement |
|---|---|---|---|---|
| 2025 | $3,395 | $216,500 | $36,800 | $179,700 |
| 2024 | $3,210 | $199,900 | $36,800 | $163,100 |
| 2023 | $3,263 | $191,400 | $38,300 | $153,100 |
| 2022 | $2,987 | $158,700 | $38,300 | $120,400 |
| 2021 | $2,950 | $156,100 | $34,800 | $121,300 |
| 2020 | $2,844 | $145,600 | $34,800 | $110,800 |
| 2019 | $2,639 | $134,100 | $34,800 | $99,300 |
| 2018 | $2,678 | $136,100 | $34,800 | $101,300 |
| 2017 | $2,615 | $133,000 | $34,800 | $98,200 |
| 2016 | $2,499 | $127,100 | $34,800 | $92,300 |
| 2015 | $1,583 | $80,500 | $34,800 | $45,700 |
C
Seller's Agent in 2016
Christine Moore
Crescent Hill Real Estate
(978) 985-8455
15 Total Sales
T
Buyer's Agent in 2016
Tanya Vital-Basile
Executive Real Estate, Inc.
G
Seller's Agent in 2014
Geraldine Marafioti
Coldwell Banker Realty - Western MA
Source: MLS Property Information Network (MLS PIN)
MLS Number: 71877338
APN: SPRI-000280-000000-000107
Disclaimer: Certain information contained herein is derived from information provided by parties other than Homes.com. All information provided is deemed reliable, but is not guaranteed to be accurate and should be independently verified.
![]() The property listing data and information, or the Images, set forth herein were provided to MLS Property Information Network, Inc. from third party sources, including sellers, lessors and public records, and were compiled by MLS Property Information Network, Inc. The property listing data and information, and the Images, are for the personal, non-commercial use of consumers having a good faith interest in purchasing or leasing listed properties of the type displayed to them and may not be used for any purpose other than to identify prospective properties which such consumers may have a good faith interest in purchasing or leasing. MLS Property Information Network, Inc. and its subscribers disclaim any and all representations and warranties as to the accuracy of the property listing data and information, or as to the accuracy of any of the Images, set forth herein.
The property listing data and information, or the Images, set forth herein were provided to MLS Property Information Network, Inc. from third party sources, including sellers, lessors and public records, and were compiled by MLS Property Information Network, Inc. The property listing data and information, and the Images, are for the personal, non-commercial use of consumers having a good faith interest in purchasing or leasing listed properties of the type displayed to them and may not be used for any purpose other than to identify prospective properties which such consumers may have a good faith interest in purchasing or leasing. MLS Property Information Network, Inc. and its subscribers disclaim any and all representations and warranties as to the accuracy of the property listing data and information, or as to the accuracy of any of the Images, set forth herein.