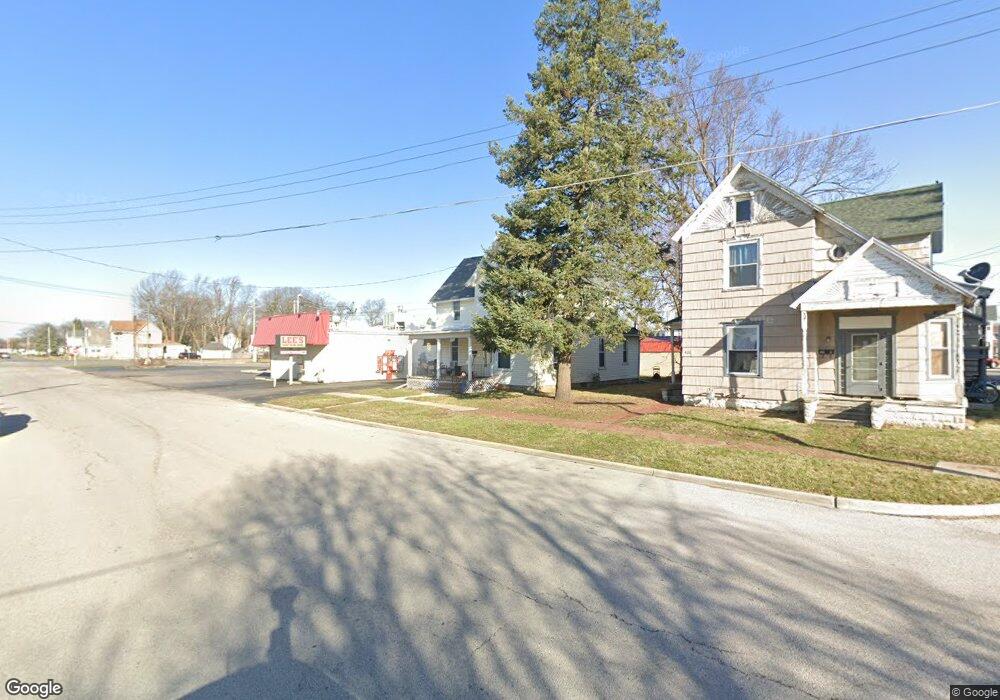
422 Center St Findlay, OH 45840
Estimated Value: $121,000 - $129,000
2
Beds
2
Baths
1,739
Sq Ft
$72/Sq Ft
Est. Value
About This Home
This home is located at 422 Center St, Findlay, OH 45840 and is currently estimated at $124,647, approximately $71 per square foot. 422 Center St is a home located in Hancock County with nearby schools including Whittier Primary School, Bigelow Hill Elementary School, and Glenwood Middle School.
Ownership History
Date
Name
Owned For
Owner Type
Purchase Details
Closed on
Aug 24, 2020
Sold by
Olson Mark L and Olson Bonnie J
Bought by
Jolliff James and Jolliff Jennifer
Current Estimated Value
Purchase Details
Closed on
Jan 13, 2009
Sold by
Hochstettler Robert
Bought by
Olson Mark L and Olson Bonnie J
Purchase Details
Closed on
Jun 3, 1994
Sold by
Hochstettler Robert
Bought by
Olson Mark and Olson Bonnie
Purchase Details
Closed on
Mar 21, 1994
Bought by
Hochstettler Robert Rev Trust
Purchase Details
Closed on
Sep 26, 1985
Bought by
Hochstettler Robert
Purchase Details
Closed on
Oct 17, 1983
Bought by
Hochstettler Robert
Create a Home Valuation Report for This Property
The Home Valuation Report is an in-depth analysis detailing your home's value as well as a comparison with similar homes in the area
Home Values in the Area
Average Home Value in this Area
Purchase History
| Date | Buyer | Sale Price | Title Company |
|---|---|---|---|
| Jolliff James | $85,000 | Assured Title Agency | |
| Olson Mark L | $35,000 | Assured Title | |
| Olson Mark | $35,000 | -- | |
| Hochstettler Robert Rev Trust | -- | -- | |
| Hochstettler Robert | -- | -- | |
| Hochstettler Robert | $29,500 | -- |
Source: Public Records
Tax History Compared to Growth
Tax History
| Year | Tax Paid | Tax Assessment Tax Assessment Total Assessment is a certain percentage of the fair market value that is determined by local assessors to be the total taxable value of land and additions on the property. | Land | Improvement |
|---|---|---|---|---|
| 2024 | $1,181 | $32,390 | $3,260 | $29,130 |
| 2023 | $1,183 | $32,390 | $3,260 | $29,130 |
| 2022 | $1,179 | $32,390 | $3,260 | $29,130 |
| 2021 | $1,015 | $24,310 | $3,420 | $20,890 |
| 2020 | $1,015 | $24,310 | $3,420 | $20,890 |
| 2019 | $995 | $24,310 | $3,420 | $20,890 |
| 2018 | $946 | $21,190 | $2,980 | $18,210 |
| 2017 | $473 | $21,190 | $2,980 | $18,210 |
| 2016 | $944 | $21,190 | $2,980 | $18,210 |
| 2015 | $732 | $16,270 | $2,980 | $13,290 |
| 2014 | $732 | $16,270 | $2,980 | $13,290 |
| 2012 | $1,032 | $22,760 | $6,700 | $16,060 |
Source: Public Records
Map
Nearby Homes
- 523 Center St
- 545 Clinton Ct
- 213 Cherry St
- 0 Canadian Way Unit 20253551
- 0 Canadian Way Unit 6135400
- 247 Crystal Ave
- 207 Ash Ave
- 210 Eastowne Park Row
- 512 N Cory St
- 224 Defiance Ave
- 706 N Cory St
- 407 Washington St
- 817 Park St
- 115 George St
- 1001 Decker Ave
- 514 Liberty St
- 829 Maple Ave
- 309 Huron Rd
- 230 Midland Ave
- 206 Midland Ave