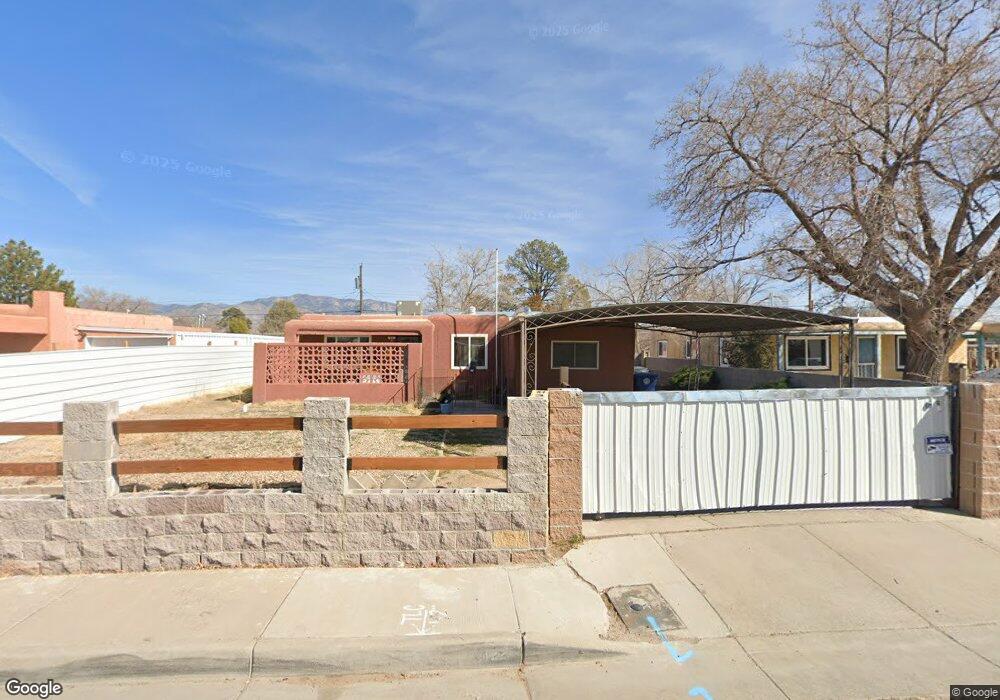
422 Chama St NE Unit 1 Albuquerque, NM 87108
Fairgrounds NeighborhoodEstimated Value: $284,000 - $321,000
3
Beds
2
Baths
1,767
Sq Ft
$173/Sq Ft
Est. Value
About This Home
This home is located at 422 Chama St NE Unit 1, Albuquerque, NM 87108 and is currently estimated at $305,185, approximately $172 per square foot. 422 Chama St NE Unit 1 is a home located in Bernalillo County with nearby schools including La Mesa Elementary School, Hayes Middle School, and Highland High School.
Ownership History
Date
Name
Owned For
Owner Type
Purchase Details
Closed on
Jun 17, 2019
Sold by
Gonzales Johnny J and Gonzales Kristi D
Bought by
Sandoval Aisha
Current Estimated Value
Home Financials for this Owner
Home Financials are based on the most recent Mortgage that was taken out on this home.
Original Mortgage
$185,250
Outstanding Balance
$162,541
Interest Rate
4.1%
Mortgage Type
New Conventional
Estimated Equity
$142,644
Purchase Details
Closed on
Aug 5, 2015
Sold by
Renewed Homes Llc
Bought by
Gonzales Johnny J and Gonzales Kristi D
Home Financials for this Owner
Home Financials are based on the most recent Mortgage that was taken out on this home.
Original Mortgage
$154,156
Interest Rate
4.4%
Mortgage Type
FHA
Purchase Details
Closed on
Jan 16, 2015
Sold by
Fannie Mae
Bought by
Renewed Homes Llc
Purchase Details
Closed on
Dec 3, 2013
Sold by
County Of Bernalillo
Bought by
Sun West Mortgage Co Inc
Create a Home Valuation Report for This Property
The Home Valuation Report is an in-depth analysis detailing your home's value as well as a comparison with similar homes in the area
Home Values in the Area
Average Home Value in this Area
Purchase History
| Date | Buyer | Sale Price | Title Company |
|---|---|---|---|
| Sandoval Aisha | -- | None Available | |
| Gonzales Johnny J | -- | First American Title Ins Co | |
| Renewed Homes Llc | $76,500 | First American Title Ins Co | |
| Sun West Mortgage Co Inc | -- | None Available |
Source: Public Records
Mortgage History
| Date | Status | Borrower | Loan Amount |
|---|---|---|---|
| Open | Sandoval Aisha | $185,250 | |
| Previous Owner | Gonzales Johnny J | $154,156 |
Source: Public Records
Tax History Compared to Growth
Tax History
| Year | Tax Paid | Tax Assessment Tax Assessment Total Assessment is a certain percentage of the fair market value that is determined by local assessors to be the total taxable value of land and additions on the property. | Land | Improvement |
|---|---|---|---|---|
| 2025 | $3,437 | $56,261 | $15,565 | $40,696 |
| 2024 | $3,437 | $81,458 | $15,565 | $65,893 |
| 2023 | $2,467 | $57,726 | $10,015 | $47,711 |
| 2022 | $2,384 | $56,045 | $9,724 | $46,321 |
| 2021 | $2,304 | $54,413 | $9,441 | $44,972 |
| 2020 | $2,266 | $52,828 | $9,166 | $43,662 |
| 2019 | $1,989 | $46,371 | $9,724 | $36,647 |
| 2018 | $1,918 | $46,371 | $9,724 | $36,647 |
| 2017 | $1,824 | $45,020 | $9,441 | $35,579 |
| 2016 | $1,831 | $43,029 | $9,166 | $33,863 |
| 2015 | $36,797 | $36,797 | $9,166 | $27,631 |
| 2014 | $1,577 | $37,130 | $9,166 | $27,964 |
| 2013 | -- | $38,967 | $8,330 | $30,637 |
Source: Public Records
Map
Nearby Homes
- 422 Chama St NE
- 513 Mesilla St NE
- 335 Alcazar St NE
- 610 Espanola St NE
- 218 Alcazar St NE
- 645 Grove St NE
- 407 Dallas St NE
- 310 Grove St NE
- 240 San Pablo St NE
- 236 San Pablo St NE
- 138 Mesilla St NE
- 6901 Lomas Blvd NE
- 128 Rhode Island St NE
- 325 Rhode Island St NE
- 321 Rhode Island St NE
- 219 Dallas St NE
- 213 Dallas St NE
- 325 Tennessee St NE
- 110 Indiana St SE Unit 1-7
- 1317 Kentucky St NE
- 418 Chama St NE
- 430 Chama St NE
- 421 Mesilla St NE
- 412 Chama St NE
- 417 Mesilla St NE
- 425 Mesilla St NE
- 413 Mesilla St NE
- 419 Chama St NE
- 434 Chama St NE
- 429 Mesilla St NE
- 429 Mesilla St NE Unit A & B
- 433 Chama St NE
- 433 Chama St NE Unit 3 1/2
- 433 Chama St NE Unit 3 1/2
- 423 Chama St NE
- 407 Chama St NE
- 406 Chama St NE
- 409 Mesilla St NE
- 433 Mesilla St NE
- 437 Chama St NE