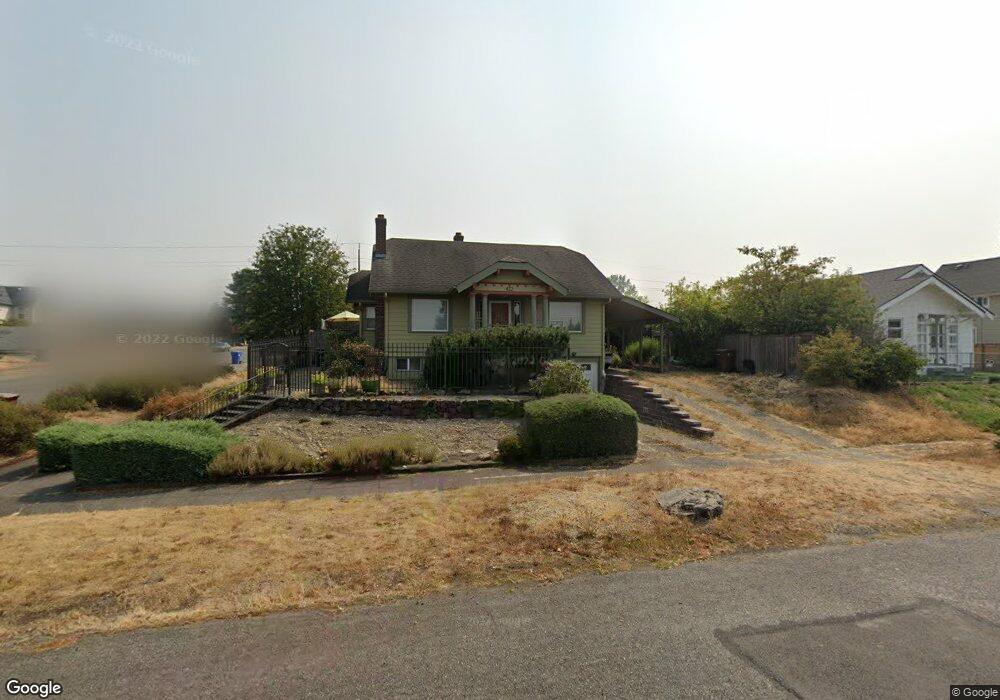
422 E 35th St Tacoma, WA 98404
Eastside NeighborhoodEstimated Value: $403,000 - $444,000
3
Beds
2
Baths
1,264
Sq Ft
$329/Sq Ft
Est. Value
About This Home
This home is located at 422 E 35th St, Tacoma, WA 98404 and is currently estimated at $415,400, approximately $328 per square foot. 422 E 35th St is a home located in Pierce County with nearby schools including Blix Elementary School, Hunt Middle School, and Lincoln High School.
Ownership History
Date
Name
Owned For
Owner Type
Purchase Details
Closed on
Jul 19, 2005
Sold by
Wells Terry L
Bought by
Raunig Lesley
Current Estimated Value
Home Financials for this Owner
Home Financials are based on the most recent Mortgage that was taken out on this home.
Original Mortgage
$176,800
Outstanding Balance
$91,396
Interest Rate
5.51%
Mortgage Type
Fannie Mae Freddie Mac
Estimated Equity
$324,004
Purchase Details
Closed on
Jan 13, 1999
Sold by
Hicks Donald L
Bought by
Wells Terry L and Wells Dennise
Home Financials for this Owner
Home Financials are based on the most recent Mortgage that was taken out on this home.
Original Mortgage
$58,300
Interest Rate
10.9%
Create a Home Valuation Report for This Property
The Home Valuation Report is an in-depth analysis detailing your home's value as well as a comparison with similar homes in the area
Home Values in the Area
Average Home Value in this Area
Purchase History
| Date | Buyer | Sale Price | Title Company |
|---|---|---|---|
| Raunig Lesley | $221,000 | Fidelity National Title Insu | |
| Wells Terry L | $84,811 | First American Title Ins Co |
Source: Public Records
Mortgage History
| Date | Status | Borrower | Loan Amount |
|---|---|---|---|
| Open | Raunig Lesley | $176,800 | |
| Previous Owner | Wells Terry L | $58,300 |
Source: Public Records
Tax History
| Year | Tax Paid | Tax Assessment Tax Assessment Total Assessment is a certain percentage of the fair market value that is determined by local assessors to be the total taxable value of land and additions on the property. | Land | Improvement |
|---|---|---|---|---|
| 2025 | $4,068 | $396,700 | $178,900 | $217,800 |
| 2024 | $4,068 | $401,500 | $172,100 | $229,400 |
| 2023 | $4,068 | $365,200 | $160,300 | $204,900 |
| 2022 | $3,756 | $385,500 | $158,600 | $226,900 |
| 2021 | $3,443 | $273,700 | $99,100 | $174,600 |
| 2019 | $2,915 | $248,100 | $82,600 | $165,500 |
| 2018 | $3,109 | $224,100 | $66,100 | $158,000 |
| 2017 | $2,670 | $196,700 | $50,500 | $146,200 |
| 2016 | $2,361 | $142,300 | $37,600 | $104,700 |
| 2014 | $2,066 | $135,700 | $36,400 | $99,300 |
| 2013 | $2,066 | $120,200 | $32,000 | $88,200 |
Source: Public Records
Map
Nearby Homes
- 515 E 34th St
- 3571 E F St
- 522 E 32nd St
- 624 E Division Ln
- 320 E 32nd St Unit 305
- 320 E 32nd St Unit 108
- 320 E 32nd St Unit 105
- 3588 Mckinley Ave
- 3617 A St
- 3201 Pacific Ave Unit 403
- 3201 Pacific Ave Unit 907
- 3209 E J St
- 3402 S C St
- 3302 S C St
- 1120 E Harrison St
- 3595 E K St
- 3807 A St
- 3108 E Valley View Terrace
- 423 S 34th St
- 3833 E G St
Your Personal Tour Guide
Ask me questions while you tour the home.