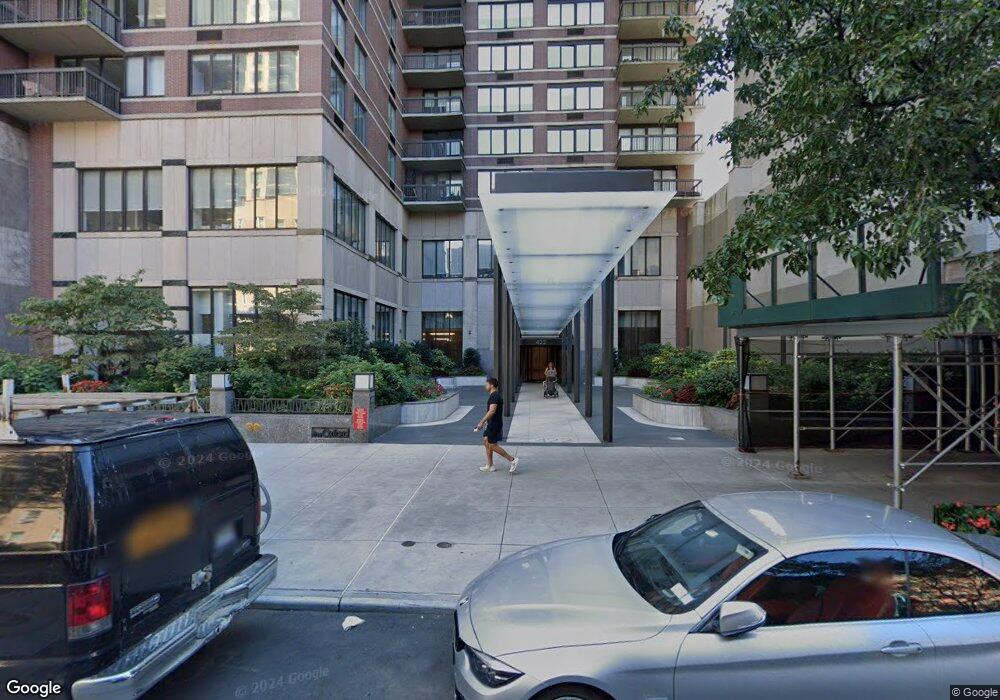
The Oxford on 72nd Street 422 E 72nd St Unit 42B New York, NY 10021
Lenox Hill NeighborhoodEstimated Value: $2,210,000 - $4,085,000
--
Bed
--
Bath
1,542
Sq Ft
$1,881/Sq Ft
Est. Value
About This Home
This home is located at 422 E 72nd St Unit 42B, New York, NY 10021 and is currently estimated at $2,900,461, approximately $1,880 per square foot. 422 E 72nd St Unit 42B is a home located in New York County with nearby schools including P.S. 183 - Robert L. Stevenson, Robert F Wagner Middle School, and Clinton School.
Ownership History
Date
Name
Owned For
Owner Type
Purchase Details
Closed on
Feb 6, 2009
Sold by
Milgrim Brett
Bought by
Nallen John P and Nallen Patricia S
Current Estimated Value
Purchase Details
Closed on
Nov 1, 2002
Sold by
Sjn Properties Llc
Bought by
Milgrim Brett
Home Financials for this Owner
Home Financials are based on the most recent Mortgage that was taken out on this home.
Original Mortgage
$1,100,000
Interest Rate
6.16%
Purchase Details
Closed on
Oct 11, 1999
Sold by
Nicholas Stephen J
Bought by
Sjn Properties Llc
Purchase Details
Closed on
Feb 3, 1994
Sold by
Resnick 72Nd St Associates
Bought by
Nicholas Stephen J
Home Financials for this Owner
Home Financials are based on the most recent Mortgage that was taken out on this home.
Original Mortgage
$600,000
Interest Rate
7.18%
Create a Home Valuation Report for This Property
The Home Valuation Report is an in-depth analysis detailing your home's value as well as a comparison with similar homes in the area
Home Values in the Area
Average Home Value in this Area
Purchase History
| Date | Buyer | Sale Price | Title Company |
|---|---|---|---|
| Nallen John P | $2,900,000 | -- | |
| Milgrim Brett | -- | -- | |
| Sjn Properties Llc | -- | -- | |
| Nicholas Stephen J | -- | -- |
Source: Public Records
Mortgage History
| Date | Status | Borrower | Loan Amount |
|---|---|---|---|
| Previous Owner | Milgrim Brett | $1,100,000 | |
| Previous Owner | Nicholas Stephen J | $600,000 |
Source: Public Records
Tax History Compared to Growth
Tax History
| Year | Tax Paid | Tax Assessment Tax Assessment Total Assessment is a certain percentage of the fair market value that is determined by local assessors to be the total taxable value of land and additions on the property. | Land | Improvement |
|---|---|---|---|---|
| 2025 | $39,903 | $320,315 | $36,428 | $283,887 |
| 2024 | $39,903 | $319,171 | $36,428 | $282,743 |
| 2023 | $32,484 | $320,978 | $36,428 | $284,550 |
| 2022 | $32,305 | $326,188 | $36,428 | $289,760 |
| 2021 | $38,879 | $316,939 | $36,428 | $280,511 |
| 2020 | $33,180 | $350,891 | $36,428 | $314,463 |
| 2019 | $31,904 | $343,000 | $36,428 | $306,572 |
| 2018 | $37,474 | $321,973 | $36,428 | $285,545 |
| 2017 | $36,240 | $313,624 | $36,428 | $277,196 |
| 2016 | $35,468 | $308,148 | $36,428 | $271,720 |
| 2015 | $14,063 | $271,806 | $36,428 | $235,378 |
| 2014 | $14,063 | $275,709 | $36,428 | $239,281 |
Source: Public Records
About The Oxford on 72nd Street
Map
Nearby Homes
- 420 E 72nd St Unit 17-F
- 420 E 72nd St Unit 19D
- 420 E 72nd St Unit 16E
- 420 E 72nd St Unit 10FG
- 420 E 72nd St Unit 15D
- 420 E 72nd St Unit 15E
- 422 E 72nd St Unit 40/41AB
- 422 E 72nd St Unit 14ABF
- 422 E 72nd St Unit 27C
- 422 E 72nd St Unit 37 AD
- 422 E 72nd St Unit 25C
- 422 E 72nd St Unit 22B
- 399 E 72nd St Unit 14-D
- 410 E 73rd St Unit 1A
- 360 E 72nd St Unit C2505
- 360 E 72nd St Unit B1408
- 360 E 72nd St Unit B811
- 360 E 72nd St Unit C1803
- 360 E 72nd St Unit C2205
- 360 E 72nd St Unit A1406
- 422 E 72nd St
- 422 E 72nd St Unit 5E
- 422 E 72nd St Unit 3A
- 422 E 72nd St Unit 30D
- 422 E 72nd St Unit 6F
- 422 E 72nd St Unit PHB
- 422 E 72nd St Unit PHA
- 422 E 72nd St Unit 42A
- 422 E 72nd St Unit 41B
- 422 E 72nd St Unit 41A
- 422 E 72nd St Unit 40B
- 422 E 72nd St Unit 40A
- 422 E 72nd St Unit 39A
- 422 E 72nd St Unit 39B
- 422 E 72nd St Unit 38C
- 422 E 72nd St Unit 38B
- 422 E 72nd St Unit 38A
- 422 E 72nd St Unit 37D
- 422 E 72nd St Unit 37C
- 422 E 72nd St Unit 37B