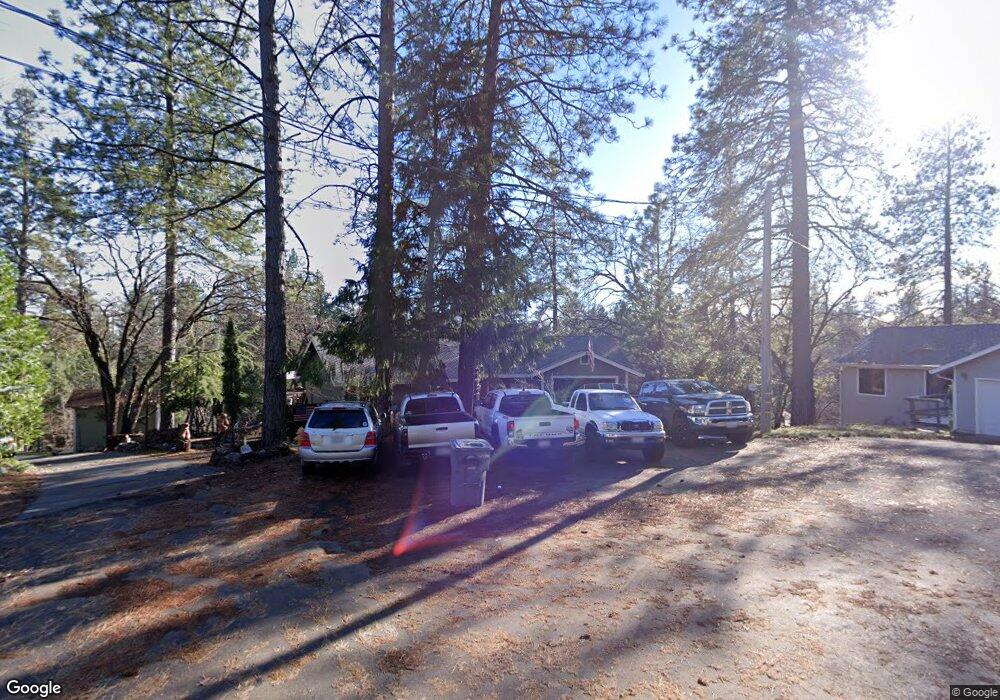
422 Knickerbocker Ct Colfax, CA 95713
Estimated Value: $487,000 - $550,000
2
Beds
2
Baths
1,479
Sq Ft
$342/Sq Ft
Est. Value
About This Home
This home is located at 422 Knickerbocker Ct, Colfax, CA 95713 and is currently estimated at $505,223, approximately $341 per square foot. 422 Knickerbocker Ct is a home located in Placer County with nearby schools including Weimar Hills, Sierra Hills Elementary School, and Colfax High School.
Ownership History
Date
Name
Owned For
Owner Type
Purchase Details
Closed on
Dec 21, 2009
Sold by
Reed Donna
Bought by
Powell Justin and Powell Audrey Rose
Current Estimated Value
Home Financials for this Owner
Home Financials are based on the most recent Mortgage that was taken out on this home.
Original Mortgage
$250,381
Outstanding Balance
$161,459
Interest Rate
4.68%
Mortgage Type
FHA
Estimated Equity
$343,764
Purchase Details
Closed on
Jun 15, 2005
Sold by
Knox Lucile M
Bought by
Reed Donna
Home Financials for this Owner
Home Financials are based on the most recent Mortgage that was taken out on this home.
Original Mortgage
$202,000
Interest Rate
5.72%
Mortgage Type
Fannie Mae Freddie Mac
Purchase Details
Closed on
Aug 18, 1995
Sold by
Knox Lucile M
Bought by
Knox Lucile M
Purchase Details
Closed on
Apr 25, 1995
Sold by
Knox Merrill T and Knox Lucile M
Bought by
Knox Merrill T and Knox Lucile M
Purchase Details
Closed on
Dec 14, 1993
Sold by
Knox Merrill T and Knox Lucile M
Bought by
Knox Merrill T and Knox Lucile M
Create a Home Valuation Report for This Property
The Home Valuation Report is an in-depth analysis detailing your home's value as well as a comparison with similar homes in the area
Home Values in the Area
Average Home Value in this Area
Purchase History
| Date | Buyer | Sale Price | Title Company |
|---|---|---|---|
| Powell Justin | $255,000 | Placer Title Company | |
| Reed Donna | $397,000 | Placer Title | |
| Knox Lucile M | -- | -- | |
| Knox Lucile M | -- | -- | |
| Knox Merrill T | -- | -- | |
| Knox Merrill T | -- | -- |
Source: Public Records
Mortgage History
| Date | Status | Borrower | Loan Amount |
|---|---|---|---|
| Open | Powell Justin | $250,381 | |
| Previous Owner | Reed Donna | $202,000 |
Source: Public Records
Tax History
| Year | Tax Paid | Tax Assessment Tax Assessment Total Assessment is a certain percentage of the fair market value that is determined by local assessors to be the total taxable value of land and additions on the property. | Land | Improvement |
|---|---|---|---|---|
| 2025 | $4,333 | $385,632 | $103,260 | $282,372 |
| 2023 | $4,333 | $370,659 | $99,251 | $271,408 |
| 2022 | $4,180 | $363,392 | $97,305 | $266,087 |
| 2021 | $4,085 | $356,268 | $95,398 | $260,870 |
| 2020 | $4,031 | $352,616 | $94,420 | $258,196 |
| 2019 | $3,949 | $345,703 | $92,569 | $253,134 |
| 2018 | $3,633 | $338,925 | $90,754 | $248,171 |
| 2017 | $3,566 | $332,280 | $88,975 | $243,305 |
| 2016 | $3,489 | $325,766 | $87,231 | $238,535 |
| 2015 | $3,405 | $320,873 | $85,921 | $234,952 |
| 2014 | $3,123 | $292,009 | $84,238 | $207,771 |
Source: Public Records
Map
Nearby Homes
- 21895 One Fine Place
- 22500 Canyon Way
- 1500 Live Oak Rd
- 20920 Sunset Way
- 21495 Snooks Rd
- 0 Forest Lake Place Unit 226017031
- 0 Forest Lake Place Unit 226016409
- 0 Forest Lake Place Unit 226017447
- 135 Ponderosa Way Unit 7
- 135 Ponderosa Way Unit 14
- 135 Ponderosa Way Unit 30
- 135 Ponderosa Way Unit 2
- 21465 Mason Rd
- 20335 Montana Ln
- 1130 Calen Way
- 717 Swanson Ln
- 23025 Placer Hills Rd
- 1045 Sierra Dawn Ln
- 308 Canyon Creek Dr
- 207 Incline Dr
- 420 Knickerbocker Ct
- 423 Knickerbocker Ct
- 650 Washington Irving Dr
- 402 Knickerbocker Ct
- 413 Knickerbocker Ct
- 635 Washington Irving Dr
- 780 Washington Irving Dr
- 403 Knickerbocker Ct
- 770 Washington Irving Dr
- 660 Washington Irving Dr
- 615 Washington Irving Dr
- 760 Washington Irving Dr
- 795 Washington Irving Dr
- 447 Catskill Dr
- 740 Washington Irving Dr
- 680 Washington Irving Dr
- 600 Washington Irving Dr
- 435 Catskill Dr
- 398 Washington Irving Dr
- 463 Catskill Dr
Your Personal Tour Guide
Ask me questions while you tour the home.