Estimated Value: $212,353
--
Bed
1
Bath
1,224
Sq Ft
$173/Sq Ft
Est. Value
About This Home
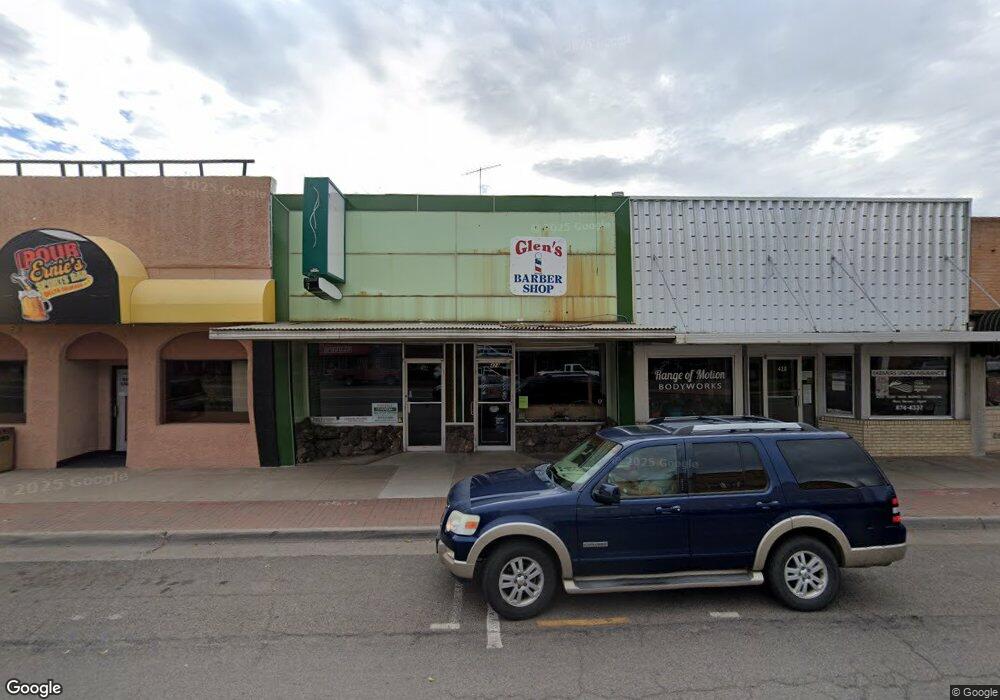
This home is located at 422 Main St, Delta, CO 81416 and is currently estimated at $212,353, approximately $173 per square foot. 422 Main St is a home located in Delta County with nearby schools including Garnet Mesa Elementary School, Lincoln Elementary School, and Delta Middle School.
Ownership History
Date
Name
Owned For
Owner Type
Purchase Details
Closed on
Mar 7, 2016
Sold by
Murray Tammy M
Bought by
Doobie Enterprises Llc
Current Estimated Value
Purchase Details
Closed on
Apr 8, 2015
Sold by
Lambda Properties Llc
Bought by
Murray Tammy M
Purchase Details
Closed on
Jun 11, 2014
Sold by
Varela Dennis W and Bank Of Colorado
Bought by
Lambda Properties Llc
Purchase Details
Closed on
Dec 17, 2003
Sold by
Schull Michael
Bought by
Doobie Enterprises Llc
Purchase Details
Closed on
Jul 7, 1992
Sold by
Webb
Bought by
Doobie Enterprises Llc and Schull
Create a Home Valuation Report for This Property
The Home Valuation Report is an in-depth analysis detailing your home's value as well as a comparison with similar homes in the area
Home Values in the Area
Average Home Value in this Area
Purchase History
| Date | Buyer | Sale Price | Title Company |
|---|---|---|---|
| Doobie Enterprises Llc | -- | None Available | |
| Murray Tammy M | $27,000 | None Available | |
| Lambda Properties Llc | -- | None Available | |
| Doobie Enterprises Llc | $65,000 | -- | |
| Doobie Enterprises Llc | $55,000 | -- |
Source: Public Records
Tax History Compared to Growth
Tax History
| Year | Tax Paid | Tax Assessment Tax Assessment Total Assessment is a certain percentage of the fair market value that is determined by local assessors to be the total taxable value of land and additions on the property. | Land | Improvement |
|---|---|---|---|---|
| 2024 | $534 | $8,071 | $4,185 | $3,886 |
| 2023 | $534 | $8,071 | $4,185 | $3,886 |
| 2022 | $1,126 | $17,444 | $4,350 | $13,094 |
| 2021 | $1,105 | $17,444 | $4,350 | $13,094 |
| 2020 | $1,190 | $18,509 | $5,510 | $12,999 |
| 2019 | $1,177 | $18,509 | $5,510 | $12,999 |
| 2018 | $1,131 | $17,144 | $4,133 | $13,011 |
| 2017 | $1,099 | $17,144 | $4,133 | $13,011 |
| 2016 | $491 | $11,992 | $4,133 | $7,859 |
| 2014 | -- | $18,830 | $4,568 | $14,262 |
Source: Public Records
Map
Nearby Homes