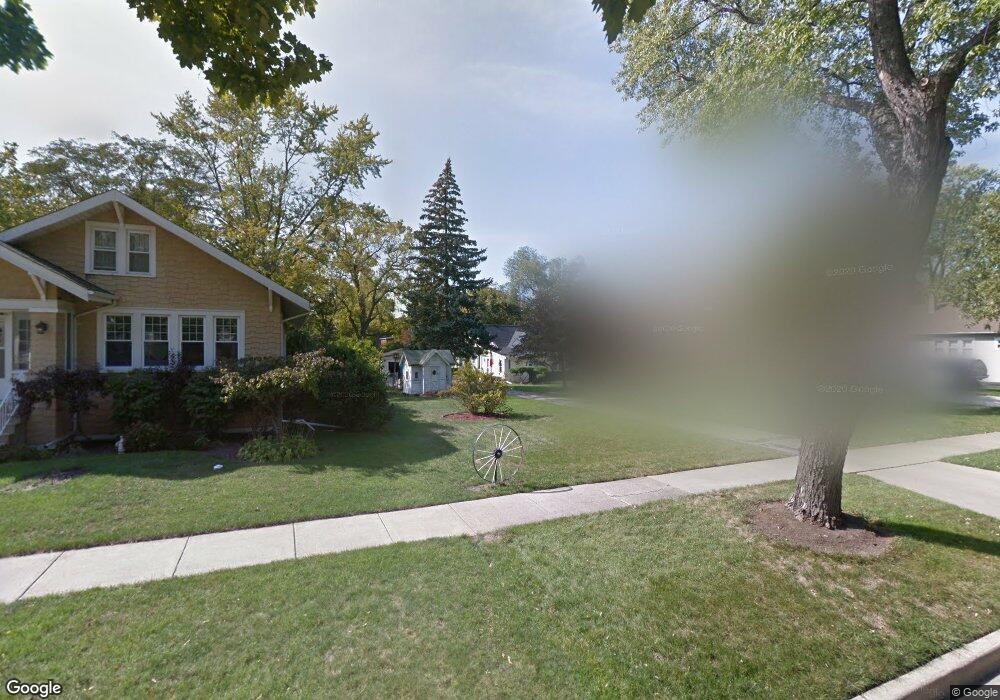
422 N Addison Ave Elmhurst, IL 60126
Estimated Value: $392,015 - $515,000
Studio
--
Bath
1,178
Sq Ft
$382/Sq Ft
Est. Value
About This Home
This home is located at 422 N Addison Ave, Elmhurst, IL 60126 and is currently estimated at $450,504, approximately $382 per square foot. 422 N Addison Ave is a home located in DuPage County with nearby schools including Emerson Elementary School, Churchville Middle School, and York Community High School.
Ownership History
Date
Name
Owned For
Owner Type
Purchase Details
Closed on
Aug 18, 2015
Sold by
Cummings Cheryl M
Bought by
Cummings Cheryl M and The Cheryl M Cummings Revocable Living T
Current Estimated Value
Home Financials for this Owner
Home Financials are based on the most recent Mortgage that was taken out on this home.
Original Mortgage
$175,100
Interest Rate
4.04%
Mortgage Type
Stand Alone Second
Purchase Details
Closed on
May 9, 2013
Sold by
Cummings Cheryl M
Bought by
Cummings Cheryl M and Cheryl M Cummings Revocable Living Trust
Create a Home Valuation Report for This Property
The Home Valuation Report is an in-depth analysis detailing your home's value as well as a comparison with similar homes in the area
Home Values in the Area
Average Home Value in this Area
Purchase History
| Date | Buyer | Sale Price | Title Company |
|---|---|---|---|
| Cummings Cheryl M | -- | Title Source Inc | |
| Cummings Cheryl M | -- | Title Source Inc | |
| Cummings Cheryl M | -- | None Available |
Source: Public Records
Mortgage History
| Date | Status | Borrower | Loan Amount |
|---|---|---|---|
| Closed | Cummings Cheryl M | $175,100 |
Source: Public Records
Tax History
| Year | Tax Paid | Tax Assessment Tax Assessment Total Assessment is a certain percentage of the fair market value that is determined by local assessors to be the total taxable value of land and additions on the property. | Land | Improvement |
|---|---|---|---|---|
| 2024 | $6,854 | $127,914 | $74,362 | $53,552 |
| 2023 | $6,270 | $117,590 | $68,360 | $49,230 |
| 2022 | $6,204 | $112,280 | $65,410 | $46,870 |
| 2021 | $5,921 | $107,540 | $62,650 | $44,890 |
| 2020 | $5,554 | $103,010 | $60,010 | $43,000 |
| 2019 | $5,482 | $99,050 | $57,700 | $41,350 |
| 2018 | $5,099 | $92,420 | $54,960 | $37,460 |
| 2017 | $4,980 | $88,330 | $52,530 | $35,800 |
| 2016 | $4,735 | $81,550 | $48,500 | $33,050 |
| 2015 | $4,604 | $75,330 | $44,800 | $30,530 |
| 2014 | $3,982 | $62,150 | $36,960 | $25,190 |
| 2013 | $3,977 | $63,410 | $37,710 | $25,700 |
Source: Public Records
Map
Nearby Homes
- 305 N Addison Ave
- 456 N Elm Ave
- 266 W Fremont Ave
- 251 W Armitage Ave
- 183 E Grantley Ave
- 132 E Gladys Ave
- 260 N Addison Ave
- 258 N Addison Ave
- 256 N Addison Ave
- 254 N Addison Ave
- 365 N Walnut St
- 234 E Grantley Ave
- 195 N Addison Ave Unit PH03
- 367 N Oak St
- 260 E Grantley Ave
- 272 N Willow Rd
- 516 N Emroy Ave
- 240 N Willow Rd
- 564 N Adele St
- 322 N Highland Ave
- 430 N Addison Ave
- 434 N Addison Ave
- 416 N Addison Ave
- 425 N Larch Ave
- 421 N Larch Ave
- 427 N Larch Ave
- 414 N Addison Ave
- 429 N Larch Ave
- 415 N Larch Ave
- 440 N Addison Ave
- 410 N Addison Ave
- 444 N Addison Ave
- 425 N Addison Ave
- 408 N Addison Ave
- 401 N Larch Ave
- 431 N Addison Ave
- 435 N Addison Ave
- 405 N Addison Ave
- 413 N Addison Ave
- 411 N Addison Ave