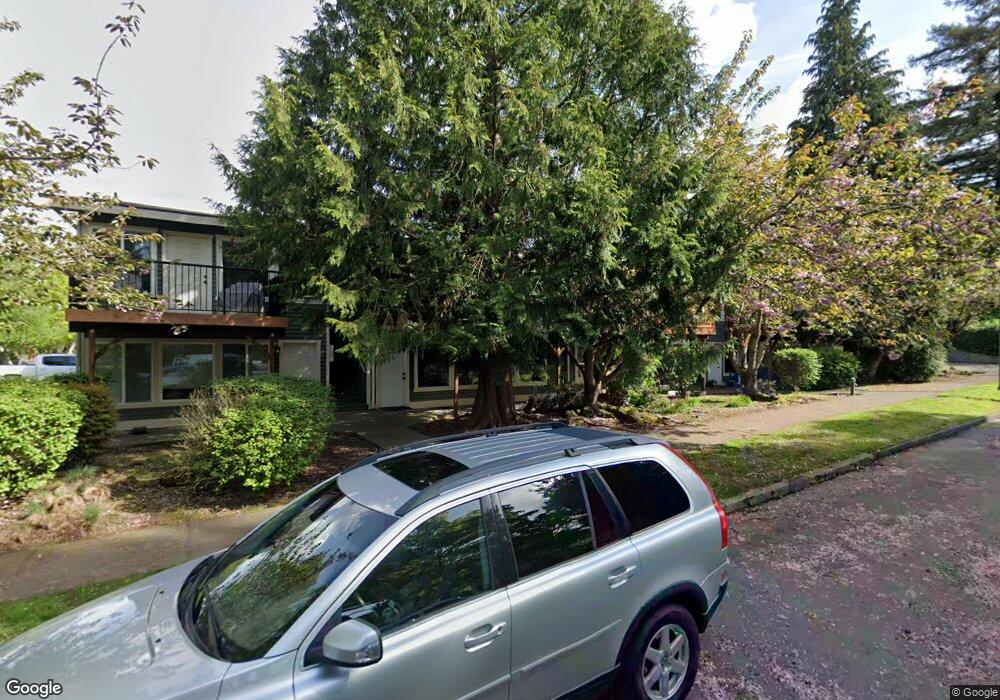
422 N L St Unit 1 Tacoma, WA 98403
North Tacoma NeighborhoodEstimated Value: $233,000 - $252,000
1
Bed
1
Bath
561
Sq Ft
$435/Sq Ft
Est. Value
About This Home
This home is located at 422 N L St Unit 1, Tacoma, WA 98403 and is currently estimated at $243,945, approximately $434 per square foot. 422 N L St Unit 1 is a home located in Pierce County with nearby schools including Grant Elementary School, Hilltop Heritage Middle School, and Stadium High School.
Ownership History
Date
Name
Owned For
Owner Type
Purchase Details
Closed on
Jul 17, 2025
Sold by
Humphrey Stephen W and Krigbaum Mary C
Bought by
James Paul W and James Dana A
Current Estimated Value
Purchase Details
Closed on
Feb 1, 2019
Sold by
Onstot Martin and Onstot Amy
Bought by
Humphrey Stephen W and Krigbaum Mary C
Home Financials for this Owner
Home Financials are based on the most recent Mortgage that was taken out on this home.
Original Mortgage
$145,125
Interest Rate
4.5%
Mortgage Type
New Conventional
Purchase Details
Closed on
Jul 31, 2009
Sold by
Onstot Martin and Onstot Amy
Bought by
Onstot Martin and Onstot Amy
Purchase Details
Closed on
Feb 16, 2007
Sold by
418 North L Llc
Bought by
Onstot Martin M
Home Financials for this Owner
Home Financials are based on the most recent Mortgage that was taken out on this home.
Original Mortgage
$123,960
Interest Rate
6.37%
Mortgage Type
New Conventional
Create a Home Valuation Report for This Property
The Home Valuation Report is an in-depth analysis detailing your home's value as well as a comparison with similar homes in the area
Home Values in the Area
Average Home Value in this Area
Purchase History
| Date | Buyer | Sale Price | Title Company |
|---|---|---|---|
| James Paul W | $245,000 | Wfg National Title Company Of | |
| Humphrey Stephen W | $193,500 | Rainier Title | |
| Onstot Martin | -- | Ticor Title Company | |
| Onstot Martin M | $154,950 | Ticor |
Source: Public Records
Mortgage History
| Date | Status | Borrower | Loan Amount |
|---|---|---|---|
| Previous Owner | Humphrey Stephen W | $145,125 | |
| Previous Owner | Onstot Martin M | $123,960 |
Source: Public Records
Tax History Compared to Growth
Tax History
| Year | Tax Paid | Tax Assessment Tax Assessment Total Assessment is a certain percentage of the fair market value that is determined by local assessors to be the total taxable value of land and additions on the property. | Land | Improvement |
|---|---|---|---|---|
| 2025 | $2,731 | $225,800 | $30,400 | $195,400 |
| 2024 | $2,731 | $250,800 | $30,400 | $220,400 |
| 2023 | $2,731 | $244,800 | $17,400 | $227,400 |
| 2022 | $2,535 | $244,800 | $17,400 | $227,400 |
| 2021 | $2,527 | $200,600 | $15,200 | $185,400 |
| 2019 | $1,901 | $182,400 | $15,200 | $167,200 |
| 2018 | $1,673 | $145,900 | $13,800 | $132,100 |
| 2017 | $1,551 | $105,600 | $29,300 | $76,300 |
| 2016 | $1,474 | $88,900 | $29,300 | $59,600 |
| 2014 | $1,595 | $84,600 | $29,300 | $55,300 |
| 2013 | $1,595 | $82,600 | $29,300 | $53,300 |
Source: Public Records
Map
Nearby Homes
- 422 N L St Unit 3
- 422 N L St Unit 8
- 422 N L St Unit 22-3
- 422 N L St Unit 22-4
- 422 N L St Unit 228
- 422 N L St Unit 227
- 422 N L St Unit 6
- 422 N L St Unit 4
- 422 N L St Unit 2
- 418 N L St Unit 18-4
- 418 N L St Unit 5
- 418 N L St Unit 3
- 418 N L St Unit 6
- 418 N L St Unit 18-1
- 418 N L St Unit 4
- 418 N L St Unit 188
- 418 N L St Unit 187
- 418 N L St Unit 186
- 418 N L St Unit 185