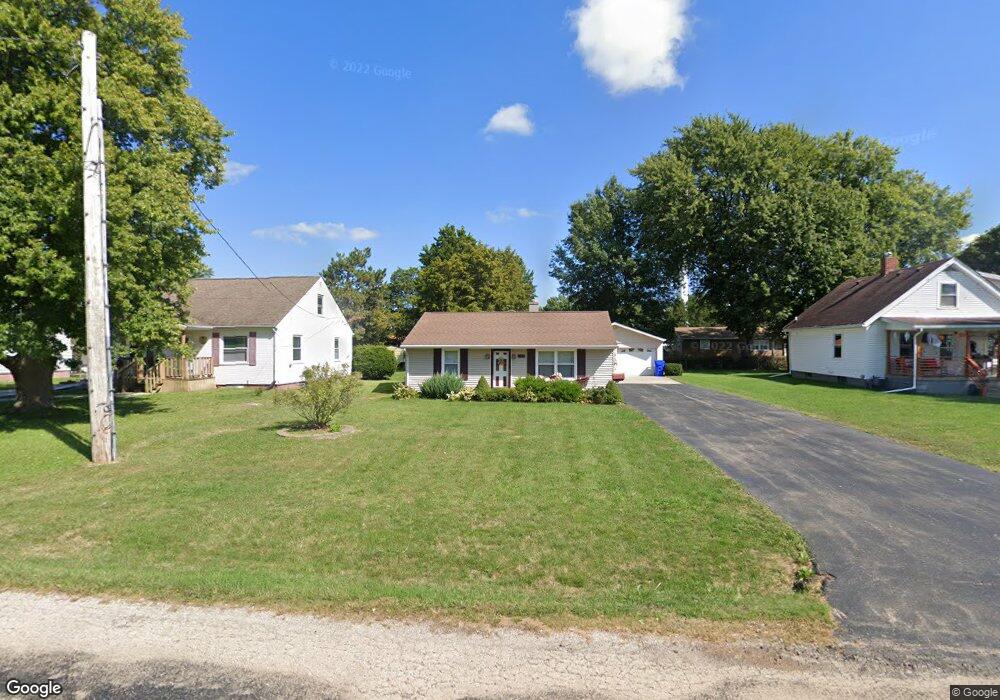
422 Payson St Kewanee, IL 61443
Estimated Value: $109,000 - $128,000
Studio
--
Bath
1,034
Sq Ft
$112/Sq Ft
Est. Value
About This Home
This home is located at 422 Payson St, Kewanee, IL 61443 and is currently estimated at $116,184, approximately $112 per square foot. 422 Payson St is a home located in Henry County with nearby schools including Wethersfield Elementary School, Wethersfield Junior/Senior High School, and Visitation Catholic School.
Ownership History
Date
Name
Owned For
Owner Type
Purchase Details
Closed on
Jul 30, 2021
Sold by
Earley Patricia A
Bought by
Rocha Alejandro
Current Estimated Value
Home Financials for this Owner
Home Financials are based on the most recent Mortgage that was taken out on this home.
Original Mortgage
$79,055
Outstanding Balance
$72,379
Interest Rate
3.37%
Mortgage Type
New Conventional
Estimated Equity
$43,805
Purchase Details
Closed on
Jun 16, 2014
Sold by
Addis Daniel K
Bought by
Earley Thomas A and Earley Patricia A
Purchase Details
Closed on
Mar 9, 2012
Sold by
Sawickis Danny L and Sawickis Dawn E
Bought by
Addis Daniel K
Home Financials for this Owner
Home Financials are based on the most recent Mortgage that was taken out on this home.
Original Mortgage
$48,500
Interest Rate
3.24%
Mortgage Type
New Conventional
Create a Home Valuation Report for This Property
The Home Valuation Report is an in-depth analysis detailing your home's value as well as a comparison with similar homes in the area
Home Values in the Area
Average Home Value in this Area
Purchase History
| Date | Buyer | Sale Price | Title Company |
|---|---|---|---|
| Rocha Alejandro | $81,500 | Western Illinois Title | |
| Earley Thomas A | $75,500 | None Available | |
| Addis Daniel K | $78,500 | None Available |
Source: Public Records
Mortgage History
| Date | Status | Borrower | Loan Amount |
|---|---|---|---|
| Open | Rocha Alejandro | $79,055 | |
| Previous Owner | Addis Daniel K | $48,500 |
Source: Public Records
Tax History
| Year | Tax Paid | Tax Assessment Tax Assessment Total Assessment is a certain percentage of the fair market value that is determined by local assessors to be the total taxable value of land and additions on the property. | Land | Improvement |
|---|---|---|---|---|
| 2024 | $2,924 | $32,760 | $1,789 | $30,971 |
| 2023 | $2,702 | $30,055 | $1,641 | $28,414 |
| 2022 | $2,614 | $29,011 | $1,584 | $27,427 |
| 2021 | $2,037 | $28,303 | $1,545 | $26,758 |
| 2020 | $1,664 | $27,680 | $1,511 | $26,169 |
| 2019 | $1,625 | $27,694 | $1,512 | $26,182 |
| 2018 | $1,631 | $27,097 | $1,479 | $25,618 |
| 2017 | $1,628 | $26,749 | $1,460 | $25,289 |
| 2016 | $1,628 | $26,020 | $1,420 | $24,600 |
| 2015 | $1,459 | $25,140 | $1,372 | $23,768 |
| 2013 | $1,459 | $24,645 | $1,345 | $23,300 |
Source: Public Records
Map
Nearby Homes
- 436 Hollis St
- 116 W Garfield St
- 136 W Mill St
- 702 Elliott St Unit 1
- 732 S Main St
- 215 W Prospect St
- 202 Regina Ct
- 328 E Prospect St
- 712 Roosevelt Ave
- 512 Commercial St
- 716 W 3rd St
- 422 Ross St
- 0 N Main St Unit E 2nd
- 522 E 5th St
- 701 E 9th St
- 1221 June St
- 2283 E 2750th St
- 24508 County Highway 28
- 806 NE 3rd St
- 417 NE 2nd St
Your Personal Tour Guide
Ask me questions while you tour the home.