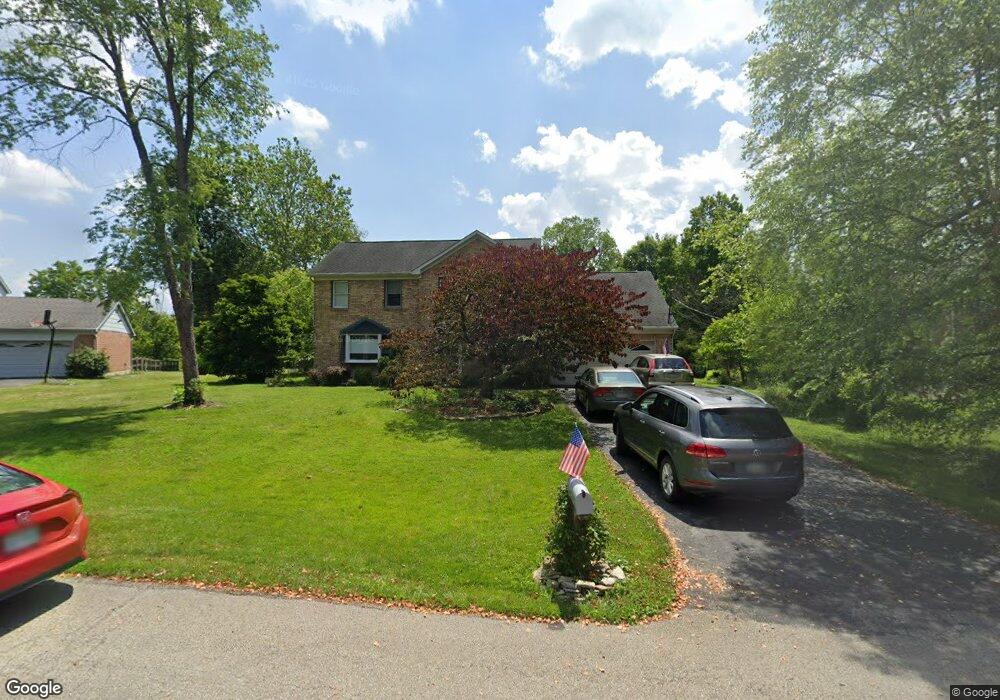
422 Pinebluff Dr Loveland, OH 45140
Outer Loveland NeighborhoodEstimated Value: $443,115 - $504,000
4
Beds
3
Baths
2,338
Sq Ft
$201/Sq Ft
Est. Value
About This Home
This home is located at 422 Pinebluff Dr, Loveland, OH 45140 and is currently estimated at $469,279, approximately $200 per square foot. 422 Pinebluff Dr is a home located in Clermont County with nearby schools including Springs East Montessori.
Ownership History
Date
Name
Owned For
Owner Type
Purchase Details
Closed on
Jul 11, 1996
Sold by
Fink John P
Bought by
Cleary Michael W and Cleary Ellen T
Current Estimated Value
Home Financials for this Owner
Home Financials are based on the most recent Mortgage that was taken out on this home.
Original Mortgage
$110,000
Interest Rate
8.09%
Mortgage Type
New Conventional
Purchase Details
Closed on
Sep 5, 1991
Purchase Details
Closed on
Sep 1, 1991
Purchase Details
Closed on
Dec 1, 1988
Create a Home Valuation Report for This Property
The Home Valuation Report is an in-depth analysis detailing your home's value as well as a comparison with similar homes in the area
Home Values in the Area
Average Home Value in this Area
Purchase History
| Date | Buyer | Sale Price | Title Company |
|---|---|---|---|
| Cleary Michael W | $168,500 | -- | |
| -- | $156,900 | -- | |
| -- | $156,900 | -- | |
| -- | $144,000 | -- |
Source: Public Records
Mortgage History
| Date | Status | Borrower | Loan Amount |
|---|---|---|---|
| Previous Owner | Cleary Michael W | $110,000 |
Source: Public Records
Tax History
| Year | Tax Paid | Tax Assessment Tax Assessment Total Assessment is a certain percentage of the fair market value that is determined by local assessors to be the total taxable value of land and additions on the property. | Land | Improvement |
|---|---|---|---|---|
| 2024 | $5,186 | $123,620 | $21,840 | $101,780 |
| 2023 | $5,269 | $123,620 | $21,840 | $101,780 |
| 2022 | $4,861 | $89,150 | $15,750 | $73,400 |
| 2021 | $4,866 | $89,150 | $15,750 | $73,400 |
| 2020 | $4,664 | $89,150 | $15,750 | $73,400 |
| 2019 | $4,703 | $85,720 | $15,680 | $70,040 |
| 2018 | $4,705 | $85,720 | $15,680 | $70,040 |
| 2017 | $4,632 | $85,720 | $15,680 | $70,040 |
| 2016 | $4,295 | $72,660 | $13,300 | $59,360 |
| 2015 | $4,007 | $72,660 | $13,300 | $59,360 |
| 2014 | $4,007 | $72,660 | $13,300 | $59,360 |
| 2013 | $3,487 | $62,690 | $14,000 | $48,690 |
Source: Public Records
Map
Nearby Homes
- 6207 Branch Hill Miamiville Rd
- 330 Whispering Pines Dr
- 9068 Link Rd
- 9248 Link Rd
- 406 Trailside Woods Ct
- 424 Trailside Woods Ct
- 423 Trailside Woods Ct
- 9561 Loveland Madeira Rd
- 417 Trailside Woods Ct
- 425 Trailside Woods Ct
- Outlot A Trailside Estates
- 8866 Humphrey St
- 6406 Hunters Close
- 6279 Emery Crossing
- 454 Loveland-Miamiville Rd
- 0 Branch Hill Miamiville Rd Unit 1870860
- 382 Brier Creek Dr
- 10564 Stablehand Dr
- 8905 Hopewell Rd
- 9675 Cunningham Rd
- 420 Pinebluff Dr
- 424 Pinebluff Dr
- 418 Pinebluff Dr
- 425 Pinebluff Dr
- 427 Pinebluff Dr
- 269 Indian View Dr
- 426 Pinebluff Dr
- 429 Pinebluff Dr
- 416 Pinebluff Dr
- 270 Indian View Dr
- 423 Pinebluff Dr
- 431 Pinebluff Dr
- Lot 24 Indian View Dr
- 421 Pinebluff Dr
- 271 Indian View Dr
- 414 Pinebluff Dr
- 419 Pinebluff Dr
- 272 Indian View Dr
- 417 Pinebluff Dr
- 6222 Hickory Ridge Dr
Your Personal Tour Guide
Ask me questions while you tour the home.