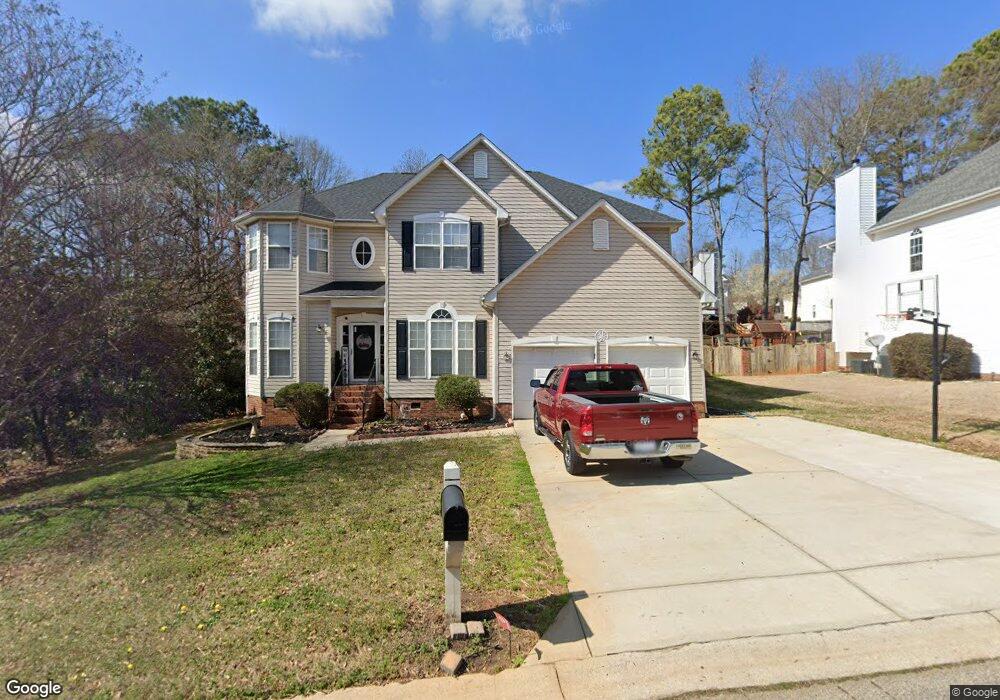
422 Rolling Pines Ln Duncan, SC 29334
Estimated Value: $318,000 - $362,936
5
Beds
3
Baths
2,879
Sq Ft
$121/Sq Ft
Est. Value
About This Home
This home is located at 422 Rolling Pines Ln, Duncan, SC 29334 and is currently estimated at $347,234, approximately $120 per square foot. 422 Rolling Pines Ln is a home located in Spartanburg County with nearby schools including Florence Chapel Middle School, Byrnes Freshman Academy, and James F. Byrnes High School.
Ownership History
Date
Name
Owned For
Owner Type
Purchase Details
Closed on
Jun 30, 2011
Sold by
Federal National Mortgage Association
Bought by
Huss Bryan T and Huss Amanda
Current Estimated Value
Home Financials for this Owner
Home Financials are based on the most recent Mortgage that was taken out on this home.
Original Mortgage
$141,324
Outstanding Balance
$96,829
Interest Rate
4.5%
Mortgage Type
FHA
Estimated Equity
$250,405
Purchase Details
Closed on
Apr 14, 2011
Sold by
Tran Rose
Bought by
Federal National Mortgage Association
Purchase Details
Closed on
Dec 14, 2004
Sold by
Steinbrecher Robin S and Scott Steinbrecher J
Bought by
Federal Home Loan Mortgage Corporation
Purchase Details
Closed on
May 29, 2001
Sold by
The Ryland Group Inc
Bought by
Steinbrecher J Scott and Steinbrecher Robin S
Create a Home Valuation Report for This Property
The Home Valuation Report is an in-depth analysis detailing your home's value as well as a comparison with similar homes in the area
Home Values in the Area
Average Home Value in this Area
Purchase History
| Date | Buyer | Sale Price | Title Company |
|---|---|---|---|
| Huss Bryan T | $145,000 | -- | |
| Federal National Mortgage Association | $2,500 | -- | |
| Federal Home Loan Mortgage Corporation | $2,500 | -- | |
| Steinbrecher J Scott | $173,821 | -- |
Source: Public Records
Mortgage History
| Date | Status | Borrower | Loan Amount |
|---|---|---|---|
| Open | Huss Bryan T | $141,324 |
Source: Public Records
Tax History
| Year | Tax Paid | Tax Assessment Tax Assessment Total Assessment is a certain percentage of the fair market value that is determined by local assessors to be the total taxable value of land and additions on the property. | Land | Improvement |
|---|---|---|---|---|
| 2022 | $1,339 | $8,663 | $1,000 | $7,663 |
| 2021 | $1,339 | $8,663 | $1,000 | $7,663 |
| 2020 | $1,222 | $8,027 | $1,038 | $6,989 |
| 2019 | $1,219 | $8,027 | $1,038 | $6,989 |
| 2018 | $1,161 | $8,027 | $1,038 | $6,989 |
| 2017 | $1,000 | $6,980 | $920 | $6,060 |
| 2016 | $962 | $6,980 | $920 | $6,060 |
| 2015 | $943 | $6,980 | $920 | $6,060 |
| 2014 | $946 | $6,980 | $920 | $6,060 |
Source: Public Records
Map
Nearby Homes
- 402 Rolling Pines Ln
- 734 Terrace Creek Dr
- 701 Terrace Creek Dr
- 756 Windward Ln
- 104 W Stableford Dr
- 662 Windward Ln
- 802 Morning Fog Dr
- 650 Windward Ln
- 406 S Lakeview Dr
- 470 Drayton Hall Blvd
- 431 Whispering Ridge Trail
- 0 Berry Shoals Rd Unit SPN332099
- 150 Santa Ana Way
- 159 Santa Ana Way
- 131 Santa Ana Way
- 307 Deer Chase Dr
- 32 Apricot Ln
- 147 Bearden Dr
- 749 W Tara Ln
- 128 Clingstone Trail
- 418 Rolling Pines Ln
- 426 Rolling Pines Ln
- 208 Timberleaf Dr
- 212 Timberleaf Dr
- 204 Timberleaf Dr
- 419 Rolling Pines Ln
- 414 Rolling Pines Ln
- 430 Rolling Pines Ln
- 415 Rolling Pines Ln
- 423 Rolling Pines Ln
- 216 Timberleaf Dr
- 200 Timberleaf Dr
- 411 Rolling Pines Ln
- 427 Rolling Pines Ln
- 410 Rolling Pines Ln
- 434 Rolling Pines Ln
- 220 Timberleaf Dr
- 518 Forest Shoals Ln
- 196 Timberleaf Dr
- 209 Timberleaf Dr
Your Personal Tour Guide
Ask me questions while you tour the home.