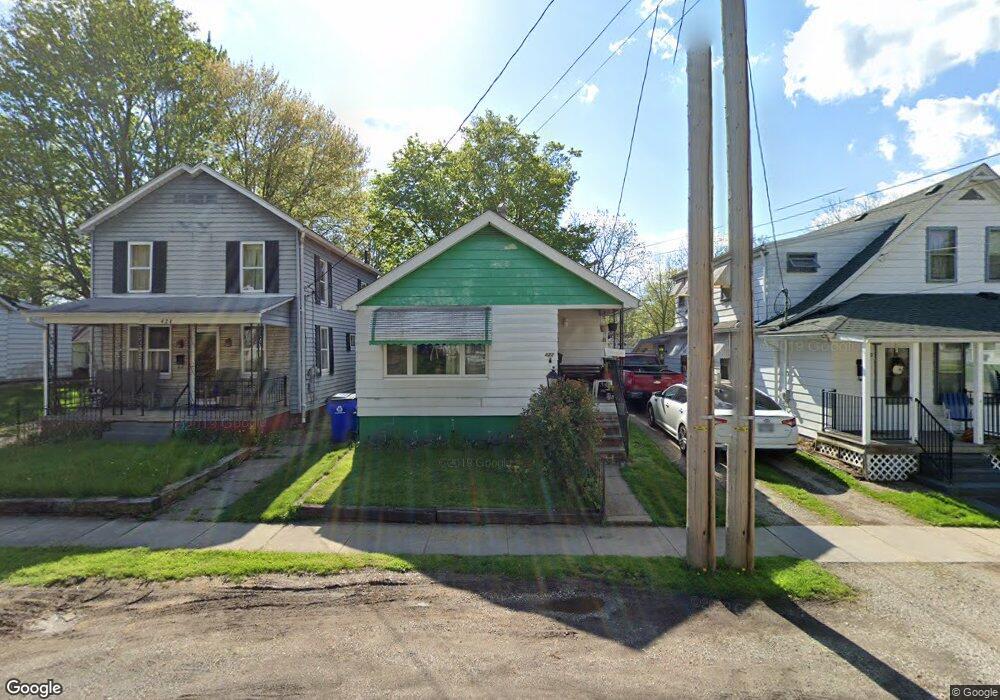
422 S Sycamore St Ravenna, OH 44266
Estimated Value: $73,000 - $105,000
2
Beds
1
Bath
781
Sq Ft
$113/Sq Ft
Est. Value
About This Home
This home is located at 422 S Sycamore St, Ravenna, OH 44266 and is currently estimated at $87,985, approximately $112 per square foot. 422 S Sycamore St is a home located in Portage County with nearby schools including West Main Elementary School, West Park Elementary School, and Brown Middle School.
Ownership History
Date
Name
Owned For
Owner Type
Purchase Details
Closed on
Aug 12, 2024
Sold by
Barker Rosia V
Bought by
Barker Rosia V and Barker Joseph D
Current Estimated Value
Purchase Details
Closed on
Feb 7, 2022
Sold by
Barker Joseph D
Bought by
Barker Rosia V
Purchase Details
Closed on
Jun 10, 2002
Sold by
Barker Montgomery Thompson H and Barker Rosia V
Bought by
Montgomery Thompson H and Barker Rosia V
Purchase Details
Closed on
May 2, 2000
Sold by
Waggoner Thelma M and Waggoner Melvin Harold
Bought by
Montgomery Thompson H and Barber Rosia V
Home Financials for this Owner
Home Financials are based on the most recent Mortgage that was taken out on this home.
Original Mortgage
$29,754
Interest Rate
8.24%
Mortgage Type
FHA
Purchase Details
Closed on
Jan 1, 1990
Bought by
Waggoner Thelma M
Create a Home Valuation Report for This Property
The Home Valuation Report is an in-depth analysis detailing your home's value as well as a comparison with similar homes in the area
Home Values in the Area
Average Home Value in this Area
Purchase History
| Date | Buyer | Sale Price | Title Company |
|---|---|---|---|
| Barker Rosia V | -- | None Listed On Document | |
| Barker Rosia V | -- | -- | |
| Montgomery Thompson H | -- | Cardinal Title Company Of Oh | |
| Montgomery Thompson H | $30,000 | Miller Examining Service Inc | |
| Waggoner Thelma M | -- | -- |
Source: Public Records
Mortgage History
| Date | Status | Borrower | Loan Amount |
|---|---|---|---|
| Previous Owner | Montgomery Thompson H | $29,754 |
Source: Public Records
Tax History Compared to Growth
Tax History
| Year | Tax Paid | Tax Assessment Tax Assessment Total Assessment is a certain percentage of the fair market value that is determined by local assessors to be the total taxable value of land and additions on the property. | Land | Improvement |
|---|---|---|---|---|
| 2024 | $264 | $17,050 | $2,170 | $14,880 |
| 2023 | $146 | $12,460 | $2,170 | $10,290 |
| 2022 | $165 | $12,460 | $2,170 | $10,290 |
| 2021 | $165 | $12,460 | $2,170 | $10,290 |
| 2020 | $100 | $10,750 | $2,170 | $8,580 |
| 2019 | $100 | $10,750 | $2,170 | $8,580 |
| 2018 | $32 | $9,350 | $2,490 | $6,860 |
| 2017 | $32 | $9,350 | $2,490 | $6,860 |
| 2016 | $466 | $9,350 | $2,490 | $6,860 |
| 2015 | $467 | $9,350 | $2,490 | $6,860 |
| 2014 | $510 | $10,230 | $2,770 | $7,460 |
| 2013 | $507 | $10,230 | $2,770 | $7,460 |
Source: Public Records
Map
Nearby Homes
- 452 Mill Rd
- 453 S Chestnut St
- 247 King St
- 208 King St
- 159 E Harris Ave
- 450 S Walnut St
- 451 Pratt St
- 656 W Highland Ave
- 856 W Main St
- 825 W Highland Ave
- 110 Oakwood St
- 646 3rd St
- 250 Lawrence St
- 347 Elm St
- 1024 W Riddle Ave
- 1057 W Riddle Ave
- 668 Westbrook Ct
- 537 Ohio Ave
- 1056 Sunnywood Ln
- 448 Woodland St
- 424 S Sycamore St
- 420 S Sycamore St
- 426 S Sycamore St
- 428 S Sycamore St
- 414 S Sycamore St
- 412 S Sycamore St
- 423 S Sycamore St
- 419 S Sycamore St
- 427 S Sycamore St
- 409 Mill Rd
- 410 S Sycamore St
- 410 S Sycamore St
- 415 S Sycamore St
- 409 S Sycamore St
- 431 S Sycamore St
- 405 Mill Rd
- 435 S Sycamore St
- V/L Mill Rd
- 271 W Riddle Ave
- 267 W Riddle Ave