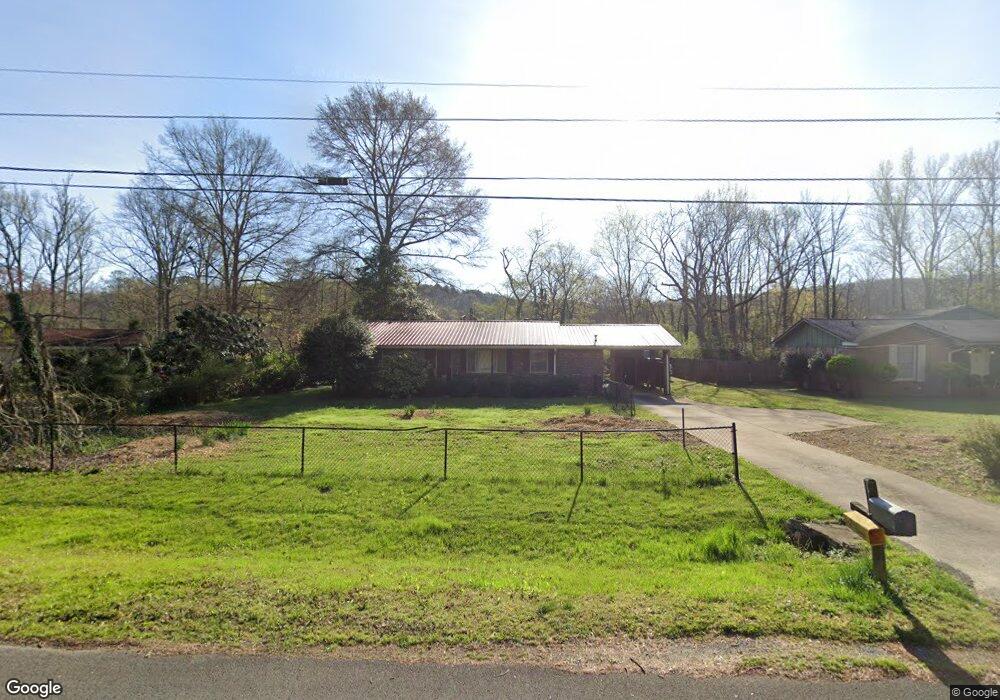
422 Strawberry Ln SE Lindale, GA 30147
Estimated Value: $145,000 - $233,000
3
Beds
2
Baths
1,515
Sq Ft
$132/Sq Ft
Est. Value
About This Home
This home is located at 422 Strawberry Ln SE, Lindale, GA 30147 and is currently estimated at $200,174, approximately $132 per square foot. 422 Strawberry Ln SE is a home located in Floyd County with nearby schools including Pepperell Middle School and Pepperell High School.
Ownership History
Date
Name
Owned For
Owner Type
Purchase Details
Closed on
Jul 31, 2017
Bought by
Wheeler Marcus V
Current Estimated Value
Home Financials for this Owner
Home Financials are based on the most recent Mortgage that was taken out on this home.
Original Mortgage
$58,000
Outstanding Balance
$30,934
Interest Rate
3.88%
Mortgage Type
New Conventional
Estimated Equity
$169,240
Purchase Details
Closed on
Jun 10, 1980
Sold by
Maxwell Doyal W
Bought by
Maxwell Atricia M Maxwell Patricia
Purchase Details
Closed on
Oct 31, 1972
Sold by
Leithuaser Don G
Bought by
Maxwell Doyal W
Purchase Details
Closed on
Apr 12, 1972
Sold by
Fountain Franklin Rene
Bought by
Leithuaser Don G
Purchase Details
Closed on
May 28, 1971
Sold by
Swindle Claude Henry and Swindle Alma
Bought by
Fountain Franklin Rene
Purchase Details
Closed on
Apr 8, 1971
Sold by
Leithauser Don G
Bought by
Swindle Claude Henry and Swindle Alma
Purchase Details
Closed on
Feb 24, 1965
Bought by
Leithauser Don G
Create a Home Valuation Report for This Property
The Home Valuation Report is an in-depth analysis detailing your home's value as well as a comparison with similar homes in the area
Home Values in the Area
Average Home Value in this Area
Purchase History
| Date | Buyer | Sale Price | Title Company |
|---|---|---|---|
| Wheeler Marcus V | $72,500 | -- | |
| Maxwell Atricia M Maxwell Patricia | -- | -- | |
| Maxwell Doyal W | $1,500 | -- | |
| Leithuaser Don G | -- | -- | |
| Fountain Franklin Rene | $1,500 | -- | |
| Swindle Claude Henry | $1,500 | -- | |
| Leithauser Don G | -- | -- |
Source: Public Records
Mortgage History
| Date | Status | Borrower | Loan Amount |
|---|---|---|---|
| Open | Wheeler Marcus V | $58,000 |
Source: Public Records
Tax History Compared to Growth
Tax History
| Year | Tax Paid | Tax Assessment Tax Assessment Total Assessment is a certain percentage of the fair market value that is determined by local assessors to be the total taxable value of land and additions on the property. | Land | Improvement |
|---|---|---|---|---|
| 2024 | $2,131 | $67,650 | $8,976 | $58,674 |
| 2023 | $1,999 | $60,269 | $8,160 | $52,109 |
| 2022 | $1,568 | $50,689 | $6,528 | $44,161 |
| 2021 | $1,468 | $46,577 | $6,528 | $40,049 |
| 2020 | $1,378 | $43,351 | $4,896 | $38,455 |
| 2019 | $1,305 | $41,618 | $4,896 | $36,722 |
| 2018 | $925 | $39,882 | $4,896 | $34,986 |
| 2017 | $1,179 | $37,353 | $4,896 | $32,457 |
| 2016 | $382 | $37,107 | $4,880 | $32,227 |
| 2015 | $361 | $37,107 | $4,880 | $32,227 |
| 2014 | $361 | $37,107 | $4,880 | $32,227 |
Source: Public Records
Map
Nearby Homes
- 413 Blackberry Ln SE
- 27 Hughes Dairy Rd SE
- 0 Booze Mountain Rd Unit 10580353
- 311 Park Ave SE
- 19 Silver Hills Rd SE
- 305 Grove Ave SE
- 1572 Booze Mountain Rd SE
- 1 Van Tassel Dr SE
- 81 Hughes Dairy Rd
- 13 N Terrace Ave SE
- 6 Hillside Ave SE
- 608 Eden Valley Rd SE
- 184 Conns Lake Extension
- 4 The Trail SE
- 12 Indian River Rd SE
- 1380 Old Cedartown Rd SE
- 0 Edenfield Dr SE Unit 21222627
- 514 Booze Mountain Rd SE
- 0 Wedgewood Dr
- 169 Jack St SE
- 420 Strawberry Ln SE
- 424 Strawberry Ln SE
- 417 Strawberry Ln SE
- 417 Strawberry Ln SE
- 418 Strawberry Ln SE
- 415 Strawberry Ln SE
- 395 Dewberry Ln SE
- 26 White Ave
- 416 Strawberry Ln SE
- 46 White Ave
- 45 White Ave SE
- 420 Spring Village Rd SE Unit 32
- 420 Spring Village Rd SE
- 418 Spring Village Rd SE
- 413 Strawberry Ln SE
- 1 W Point Dr SE
- 416 Spring Village Rd SE
- Lot 26 Dewberry Ln
- 24 Davis Aly
- 30 Davis Aly