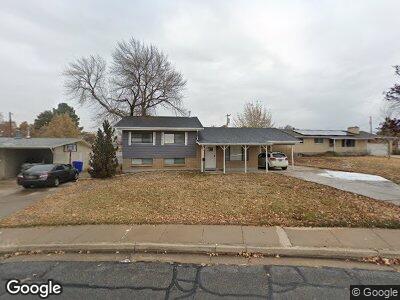
422 W 2125 N Clearfield, UT 84015
Sunset NeighborhoodEstimated Value: $379,000 - $429,000
3
Beds
2
Baths
1,675
Sq Ft
$246/Sq Ft
Est. Value
About This Home
This home is located at 422 W 2125 N, Clearfield, UT 84015 and is currently estimated at $412,521, approximately $246 per square foot. 422 W 2125 N is a home located in Davis County with nearby schools including Sunset School, Sunset Junior High School, and Northridge High School.
Ownership History
Date
Name
Owned For
Owner Type
Purchase Details
Closed on
May 27, 2021
Sold by
Namazi Hassan and Namazi Alma Flores
Bought by
Arvm 5 Llc
Current Estimated Value
Purchase Details
Closed on
Jul 25, 2016
Sold by
Wells Fargo Bank
Bought by
Namazi Hassan
Purchase Details
Closed on
Jul 3, 2014
Sold by
Clark Kristina L
Bought by
Hooper Zachary D
Purchase Details
Closed on
Apr 29, 2008
Sold by
Hooper Zachary D
Bought by
Hooper Zachary D and Clark Kristina L
Home Financials for this Owner
Home Financials are based on the most recent Mortgage that was taken out on this home.
Original Mortgage
$147,682
Interest Rate
5.81%
Mortgage Type
FHA
Purchase Details
Closed on
Nov 22, 2004
Sold by
Caldwell William H and Caldwell Jacqueline F
Bought by
Salisbury Jacob
Create a Home Valuation Report for This Property
The Home Valuation Report is an in-depth analysis detailing your home's value as well as a comparison with similar homes in the area
Home Values in the Area
Average Home Value in this Area
Purchase History
| Date | Buyer | Sale Price | Title Company |
|---|---|---|---|
| Arvm 5 Llc | -- | Bchh Inc | |
| Namazi Hassan | -- | Boston National Title | |
| Hooper Zachary D | -- | Inwest Title Servic | |
| Hooper Zachary D | -- | Utah Commercial Title Co | |
| Hooper Zachary D | -- | First American Title | |
| Salisbury Jacob | -- | Founders Title Co |
Source: Public Records
Mortgage History
| Date | Status | Borrower | Loan Amount |
|---|---|---|---|
| Previous Owner | Hooper Zachary D | $147,682 | |
| Previous Owner | Salisbury Jacob | $116,750 |
Source: Public Records
Tax History Compared to Growth
Tax History
| Year | Tax Paid | Tax Assessment Tax Assessment Total Assessment is a certain percentage of the fair market value that is determined by local assessors to be the total taxable value of land and additions on the property. | Land | Improvement |
|---|---|---|---|---|
| 2024 | $3,902 | $195,799 | $73,949 | $121,850 |
| 2023 | $3,618 | $182,050 | $64,801 | $117,249 |
| 2022 | $3,854 | $347,000 | $121,967 | $225,033 |
| 2021 | $1,640 | $232,000 | $73,862 | $158,138 |
| 2020 | $1,430 | $199,000 | $62,619 | $136,381 |
| 2019 | $1,345 | $192,000 | $76,936 | $115,064 |
| 2018 | $1,188 | $166,000 | $61,484 | $104,516 |
| 2016 | $926 | $66,440 | $29,083 | $37,357 |
| 2015 | $980 | $66,660 | $29,083 | $37,577 |
| 2014 | $926 | $64,374 | $29,259 | $35,115 |
| 2013 | -- | $64,933 | $23,265 | $41,668 |
Source: Public Records
Map
Nearby Homes
- 2177 N 450 W
- 2045 N 300 W
- 594 W 2200 N
- 2323 N 475 W
- 2196 N 250 W
- 2144 N 750 W
- 2348 N 720 W
- 2085 N Main St Unit 101
- 2085 N Main St Unit 108
- 2085 N Main St Unit 102
- 2544 N 475 W
- 2101 N Main St Unit 409
- 2101 N Main St Unit 302
- 2101 N Main St Unit 205
- 1721 N 400 W
- 1883 N 750 W
- 2072 N 900 W
- 2609 N 500 W
- 2624 N 525 W
- 428 W 2650 N