4220 Bertram Dr Raleigh, NC 27604
Atlantic NeighborhoodEstimated Value: $351,000 - $442,000
Studio
2
Baths
2,470
Sq Ft
$168/Sq Ft
Est. Value
About This Home
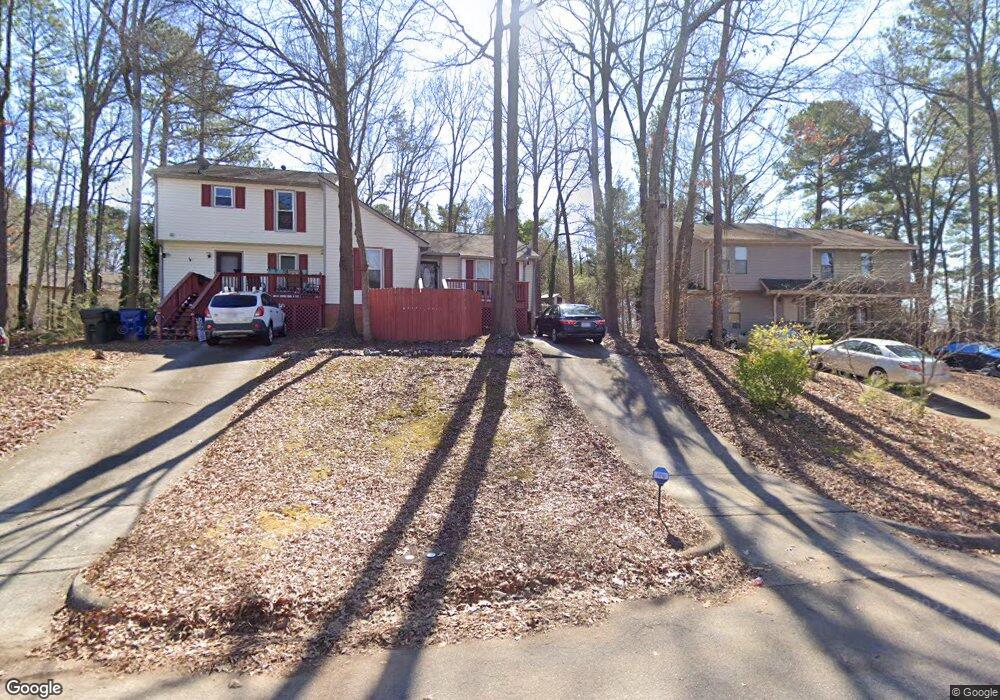
This home is located at 4220 Bertram Dr, Raleigh, NC 27604 and is currently estimated at $414,905, approximately $167 per square foot. 4220 Bertram Dr is a home located in Wake County with nearby schools including Brassfield Elementary School, West Millbrook Middle School, and Heritage High School.
Ownership History
Date
Name
Owned For
Owner Type
Purchase Details
Closed on
Nov 9, 2017
Sold by
Fitzgerlad Michael W and Fitzgerlad Amanda
Bought by
Pacelli Christopher J
Current Estimated Value
Home Financials for this Owner
Home Financials are based on the most recent Mortgage that was taken out on this home.
Original Mortgage
$168,000
Outstanding Balance
$140,702
Interest Rate
3.83%
Mortgage Type
New Conventional
Estimated Equity
$274,203
Purchase Details
Closed on
May 24, 2016
Sold by
Worthy Investing Llc
Bought by
Fitzgerald Michael W
Home Financials for this Owner
Home Financials are based on the most recent Mortgage that was taken out on this home.
Original Mortgage
$105,500
Interest Rate
3.59%
Mortgage Type
New Conventional
Purchase Details
Closed on
Oct 28, 2013
Sold by
Bapple Thomas M and Bapple Desiree T
Bought by
Worthy Investing Llc
Home Financials for this Owner
Home Financials are based on the most recent Mortgage that was taken out on this home.
Original Mortgage
$112,000
Interest Rate
4.57%
Mortgage Type
Commercial
Create a Home Valuation Report for This Property
The Home Valuation Report is an in-depth analysis detailing your home's value as well as a comparison with similar homes in the area
Home Values in the Area
Average Home Value in this Area
Purchase History
| Date | Buyer | Sale Price | Title Company |
|---|---|---|---|
| Pacelli Christopher J | $210,000 | None Available | |
| Fitzgerald Michael W | -- | None Available | |
| Worthy Investing Llc | $145,000 | None Available |
Source: Public Records
Mortgage History
| Date | Status | Borrower | Loan Amount |
|---|---|---|---|
| Open | Pacelli Christopher J | $168,000 | |
| Previous Owner | Fitzgerald Michael W | $105,500 | |
| Previous Owner | Worthy Investing Llc | $112,000 |
Source: Public Records
Tax History
| Year | Tax Paid | Tax Assessment Tax Assessment Total Assessment is a certain percentage of the fair market value that is determined by local assessors to be the total taxable value of land and additions on the property. | Land | Improvement |
|---|---|---|---|---|
| 2025 | $4,118 | $467,565 | $150,000 | $317,565 |
| 2024 | $4,101 | $467,565 | $150,000 | $317,565 |
Source: Public Records
Map
Nearby Homes
- 4802 Parkville Dr
- 2800 Greenock Dr
- 3712 Huntleigh Dr
- 4816 Whitehall Ave
- 3216 Broyhill Cir
- 4205 Waterbury Rd
- 3605 Brentwood Rd
- 3540 Carolyn Dr
- 4257 Lake Ridge Dr
- 3523 Brentwood Rd
- 4367 Bona Ct
- 3618 Pine Knoll Dr
- 4600 Old Wake Forest Rd
- 3415 Carolyn Dr
- 3531 Oneonta Ave
- 3502 Oneonta Ave
- 3228 Julian Dr
- 1733 Sorrell Brook Way
- 1725 Sorrell Brook Way
- 1721 Tiffany Bay Ct Unit 204
- 4221 Bertram Dr
- 4218 Bertram Dr
- 4224 Bertram Dr
- 4216 Bertram Dr
- 4209 Greencastle Ct Unit E
- 4209 Greencastle Ct Unit C
- 4209 Greencastle Ct
- 4209 Greencastle Ct Unit A
- 4209 Greencastle Ct Unit F
- 4209 Greencastle Ct Unit D
- 4209 Greencastle Ct Unit B
- 4212 Bertram Dr
- 4230 Bertram Dr
- 4228 Bertram Dr
- 4205 Greencastle Ct
- 4205 Greencastle Ct Unit D
- 4205 Greencastle Ct Unit B
- 4205 Greencastle Ct Unit C
- 4205 Greencastle Ct Unit A
- 4205 Greencastle Ct Unit C