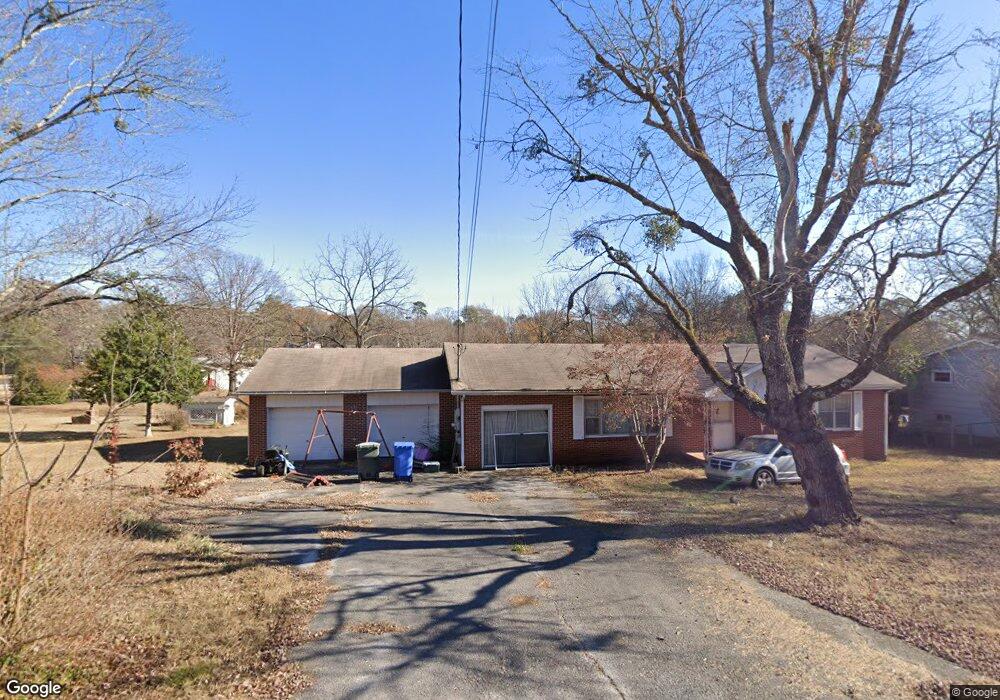
4220 Linton Ave Chattanooga, TN 37416
Bonny Oaks-Highway 58 NeighborhoodEstimated Value: $229,204 - $274,000
--
Bed
1
Bath
1,539
Sq Ft
$161/Sq Ft
Est. Value
About This Home
This home is located at 4220 Linton Ave, Chattanooga, TN 37416 and is currently estimated at $248,301, approximately $161 per square foot. 4220 Linton Ave is a home located in Hamilton County with nearby schools including Harrison Elementary School, Brown Middle School, and Central High School.
Ownership History
Date
Name
Owned For
Owner Type
Purchase Details
Closed on
May 11, 2001
Sold by
Morgan Lawrence E and Morgan Margaret A
Bought by
Nimmo Walter K
Current Estimated Value
Home Financials for this Owner
Home Financials are based on the most recent Mortgage that was taken out on this home.
Original Mortgage
$82,499
Outstanding Balance
$3,452
Interest Rate
7.05%
Estimated Equity
$244,849
Purchase Details
Closed on
Aug 14, 1998
Sold by
Atkins Jerald A and Atkins Linda B
Bought by
Morgan Lawrence E and Cason Margaret
Home Financials for this Owner
Home Financials are based on the most recent Mortgage that was taken out on this home.
Original Mortgage
$65,000
Interest Rate
6.91%
Purchase Details
Closed on
Oct 31, 1996
Sold by
Miller Jerry M and Miller Barbara A
Bought by
Atkins Jerald A and Atkins Linda B
Home Financials for this Owner
Home Financials are based on the most recent Mortgage that was taken out on this home.
Original Mortgage
$62,467
Interest Rate
8.15%
Mortgage Type
FHA
Create a Home Valuation Report for This Property
The Home Valuation Report is an in-depth analysis detailing your home's value as well as a comparison with similar homes in the area
Home Values in the Area
Average Home Value in this Area
Purchase History
| Date | Buyer | Sale Price | Title Company |
|---|---|---|---|
| Nimmo Walter K | $90,000 | -- | |
| Morgan Lawrence E | $73,000 | -- | |
| Atkins Jerald A | $62,500 | -- |
Source: Public Records
Mortgage History
| Date | Status | Borrower | Loan Amount |
|---|---|---|---|
| Open | Nimmo Walter K | $82,499 | |
| Previous Owner | Morgan Lawrence E | $65,000 | |
| Previous Owner | Atkins Jerald A | $62,467 |
Source: Public Records
Tax History Compared to Growth
Tax History
| Year | Tax Paid | Tax Assessment Tax Assessment Total Assessment is a certain percentage of the fair market value that is determined by local assessors to be the total taxable value of land and additions on the property. | Land | Improvement |
|---|---|---|---|---|
| 2024 | $965 | $43,125 | $0 | $0 |
| 2023 | $965 | $43,125 | $0 | $0 |
| 2022 | $965 | $43,125 | $0 | $0 |
| 2021 | $965 | $43,125 | $0 | $0 |
| 2020 | $905 | $32,725 | $0 | $0 |
| 2019 | $905 | $32,725 | $0 | $0 |
| 2018 | $872 | $32,725 | $0 | $0 |
| 2017 | $905 | $32,725 | $0 | $0 |
| 2016 | $814 | $0 | $0 | $0 |
| 2015 | $1,610 | $29,450 | $0 | $0 |
| 2014 | $1,610 | $0 | $0 | $0 |
Source: Public Records
Map
Nearby Homes
- 4202 Davis Ln
- 4618 Maywood Ln
- 4105 Wilkesview Dr
- 4209 Willard Dr
- 4716 Briarwood Cir
- 4516 Lockington Ln
- 3904 Lightfoot Mill Rd
- 3900 Lightfoot Mill Rd
- 4399 Byrd Ave
- 0 Bonny Oaks Dr Unit 1505693
- 4726 Tarpon Trail
- 4608 Beverly Kay Dr
- 0 Chickamauga Ave
- 4607 Murray Lake Ln
- 4511 Murray Hills Dr
- 4717 Beverly Kay Dr
- 4605 Tarpon Trail Unit 5
- 4611 Tarpon Trail
- 4609 Tarpon Trail
- 3408 Fleeta Ln
- 4216 Linton Ave
- 4222 Linton Ave
- 4219 Bellview Ave
- 4217 Bellview Ave
- 4221 Bellview Ave
- 4215 Bellview Ave
- 4214 Linton Ave
- 4221 Linton Ave
- 4219 Linton Ave
- 6430 Paw Trail
- 4215 Linton Ave
- 4223 Linton Ave
- 4213 Bellview Ave
- 4212 Linton Ave
- 4211 Bellview Ave
- 4523 Paw Trail
- 4216 Bellview Ave
- 4511 Paw Trail
- 4521 Paw Trail
- 4214 Bellview Ave