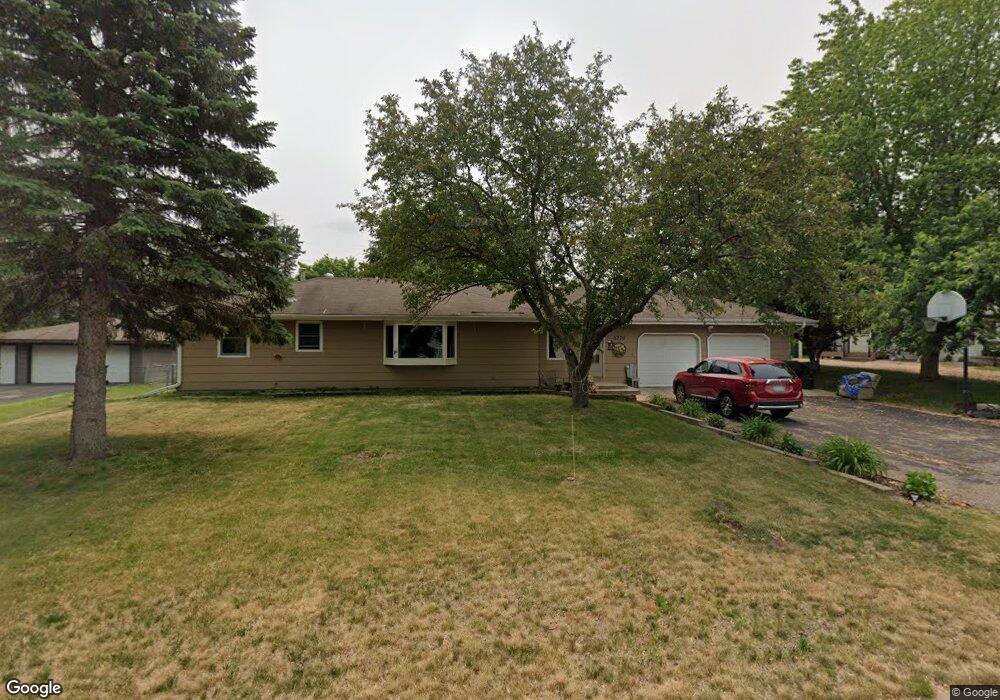
4220 Upper 149th St W Rosemount, MN 55068
Estimated Value: $341,000 - $361,000
3
Beds
1
Bath
1,224
Sq Ft
$284/Sq Ft
Est. Value
About This Home
This home is located at 4220 Upper 149th St W, Rosemount, MN 55068 and is currently estimated at $347,760, approximately $284 per square foot. 4220 Upper 149th St W is a home located in Dakota County with nearby schools including Diamond Path Elementary School of International Studies, Rosemount Middle School, and Rosemount Senior High School.
Ownership History
Date
Name
Owned For
Owner Type
Purchase Details
Closed on
Jun 4, 2015
Sold by
Peterson Zachary and Peterson Ranae
Bought by
Lloyd Chloe and Lloyd Jake
Current Estimated Value
Home Financials for this Owner
Home Financials are based on the most recent Mortgage that was taken out on this home.
Original Mortgage
$160,000
Outstanding Balance
$124,233
Interest Rate
3.82%
Mortgage Type
New Conventional
Estimated Equity
$223,527
Purchase Details
Closed on
Jul 30, 2012
Sold by
Pnc Bank National Association
Bought by
Peterson Zachary and Peterson Chloe
Home Financials for this Owner
Home Financials are based on the most recent Mortgage that was taken out on this home.
Original Mortgage
$159,065
Interest Rate
4%
Mortgage Type
FHA
Purchase Details
Closed on
Nov 4, 2011
Sold by
Mcnearney Erica
Bought by
Pnc Bank National Association
Purchase Details
Closed on
Aug 12, 2004
Sold by
Wallace John Richard and Wallace Sandra J
Bought by
Not Provided
Create a Home Valuation Report for This Property
The Home Valuation Report is an in-depth analysis detailing your home's value as well as a comparison with similar homes in the area
Home Values in the Area
Average Home Value in this Area
Purchase History
| Date | Buyer | Sale Price | Title Company |
|---|---|---|---|
| Lloyd Chloe | -- | None Available | |
| Peterson Zachary | $162,000 | West Title Llc | |
| Pnc Bank National Association | $165,343 | None Available | |
| Not Provided | $204,900 | -- |
Source: Public Records
Mortgage History
| Date | Status | Borrower | Loan Amount |
|---|---|---|---|
| Open | Lloyd Chloe | $160,000 | |
| Previous Owner | Peterson Zachary | $159,065 |
Source: Public Records
Tax History
| Year | Tax Paid | Tax Assessment Tax Assessment Total Assessment is a certain percentage of the fair market value that is determined by local assessors to be the total taxable value of land and additions on the property. | Land | Improvement |
|---|---|---|---|---|
| 2024 | $3,166 | $304,800 | $71,900 | $232,900 |
| 2023 | $3,166 | $298,900 | $72,700 | $226,200 |
| 2022 | $2,796 | $301,200 | $72,400 | $228,800 |
| 2021 | $2,738 | $256,300 | $63,000 | $193,300 |
| 2020 | $2,620 | $246,400 | $60,000 | $186,400 |
| 2019 | $2,243 | $228,500 | $57,100 | $171,400 |
| 2018 | $2,252 | $208,100 | $56,000 | $152,100 |
| 2017 | $2,371 | $202,600 | $53,400 | $149,200 |
| 2016 | $2,228 | $189,000 | $51,800 | $137,200 |
| 2015 | $2,053 | $173,900 | $50,300 | $123,600 |
| 2014 | -- | $159,700 | $47,600 | $112,100 |
| 2013 | -- | $146,200 | $44,000 | $102,200 |
Source: Public Records
Map
Nearby Homes
- 15025 Everleigh Cir
- 15149 December Trail
- 1620 144th St E
- 14774 Delmar Ct
- 22367 Denmark Ct
- 22369 Denmark Ct
- 22371 Denmark Ct
- 22373 Denmark Ct
- 15157 Crestone Cir
- 4141 154th Ct W
- 15078 Dunwood Trail Unit 33
- 15163 Claret Cir
- 15493 Dresden Trail
- 15057 Dunwood Trail Unit 58
- 4275 155th Ct
- 14595 Cobalt Ave Unit 37
- 14896 Cimarron Ave W
- 15429 Darling Path
- 14483 Crescent Cir
- 3697 152nd St W
- 4220 Upper 149th St W
- 4240 Upper 149th St W
- 4200 Upper 149th St W
- 4240 Upper 149th St W
- 4235 Upper 149th St W
- 4235 4235 Upper 150th St W--
- 4235 150th St W
- 4235 Upper 149th St W
- 4260 Upper 149th St W
- 4180 Upper 149th St W
- 4215 Upper 150th St W
- 4195 Upper 149th St W
- 4245 Upper 149th St W
- 4265 Upper 149th St W
- 4280 Upper 149th St W
- 4265 Upper 149th St W
- 4180 Upper 150th St W
- 15067 December Way
- 4175 Upper 150th St W
- 15081 December Way
Your Personal Tour Guide
Ask me questions while you tour the home.