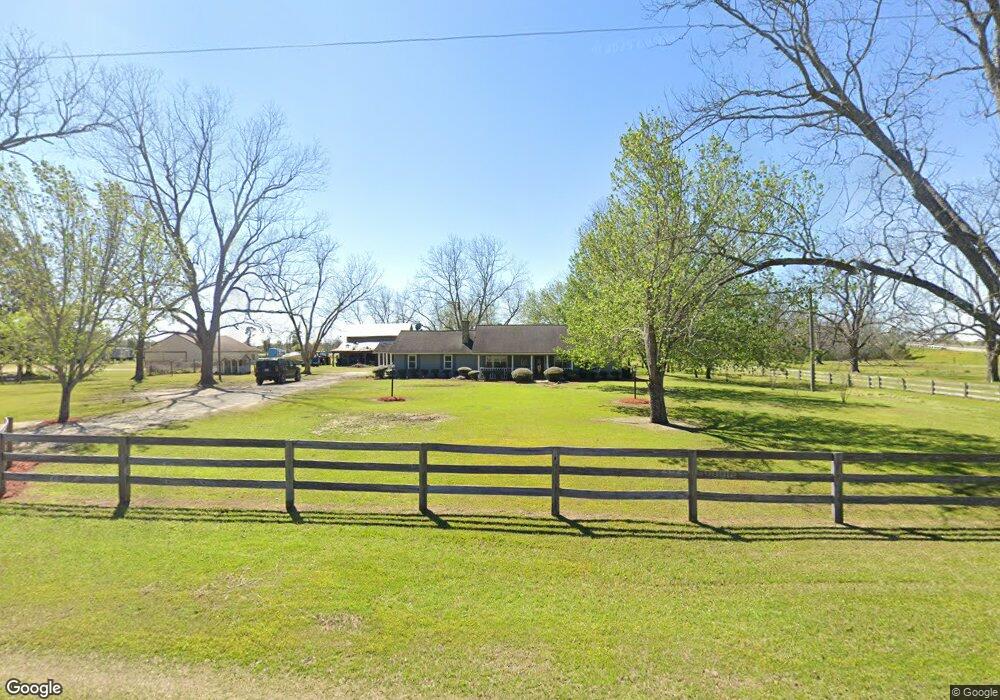
4220 Us Highway 41 S Tifton, GA 31794
Estimated Value: $295,000 - $321,212
3
Beds
3
Baths
1,872
Sq Ft
$165/Sq Ft
Est. Value
About This Home
This home is located at 4220 Us Highway 41 S, Tifton, GA 31794 and is currently estimated at $309,553, approximately $165 per square foot. 4220 Us Highway 41 S is a home located in Tift County with nearby schools including J.T. Reddick School, Matt Wilson Elementary School, and Annie Belle Clark Primary School.
Ownership History
Date
Name
Owned For
Owner Type
Purchase Details
Closed on
May 21, 2025
Sold by
Werth Trena
Bought by
Conner Deloria J and Conner Roger D
Current Estimated Value
Home Financials for this Owner
Home Financials are based on the most recent Mortgage that was taken out on this home.
Original Mortgage
$100,000
Outstanding Balance
$99,829
Interest Rate
6.81%
Mortgage Type
New Conventional
Estimated Equity
$209,724
Purchase Details
Closed on
Aug 19, 2022
Sold by
Renew Roy W
Bought by
Werth William C and Werth Trena M
Purchase Details
Closed on
Oct 24, 2018
Sold by
Spicer Sharon A
Bought by
Renew Roy W
Home Financials for this Owner
Home Financials are based on the most recent Mortgage that was taken out on this home.
Original Mortgage
$183,250
Interest Rate
4.7%
Purchase Details
Closed on
Mar 16, 2011
Sold by
Spicer Charles and Spicer Sharon A
Bought by
Spicer Charles E and Spicer Sharon A
Home Financials for this Owner
Home Financials are based on the most recent Mortgage that was taken out on this home.
Original Mortgage
$270,000
Interest Rate
2.75%
Mortgage Type
Reverse Mortgage Home Equity Conversion Mortgage
Purchase Details
Closed on
Dec 16, 2005
Sold by
Revels Jerry M
Bought by
Spicer Charles and Spicer Sharon
Purchase Details
Closed on
Apr 2, 1987
Bought by
Hampton Thelma
Create a Home Valuation Report for This Property
The Home Valuation Report is an in-depth analysis detailing your home's value as well as a comparison with similar homes in the area
Home Values in the Area
Average Home Value in this Area
Purchase History
| Date | Buyer | Sale Price | Title Company |
|---|---|---|---|
| Conner Deloria J | $310,000 | -- | |
| Werth William C | $280,000 | -- | |
| Renew Roy W | $183,250 | -- | |
| Spicer Charles E | -- | -- | |
| Spicer Charles | $155,000 | -- | |
| Hampton Thelma | $50,000 | -- |
Source: Public Records
Mortgage History
| Date | Status | Borrower | Loan Amount |
|---|---|---|---|
| Open | Conner Deloria J | $100,000 | |
| Previous Owner | Renew Roy W | $261,100 | |
| Previous Owner | Renew Roy W | $207,000 | |
| Previous Owner | Renew Roy W | $187,450 | |
| Previous Owner | Renew Roy W | $183,250 | |
| Previous Owner | Spicer Charles E | $270,000 | |
| Previous Owner | Spicer Charles | $27,753 | |
| Previous Owner | Spicer Charles | $0 |
Source: Public Records
Tax History Compared to Growth
Tax History
| Year | Tax Paid | Tax Assessment Tax Assessment Total Assessment is a certain percentage of the fair market value that is determined by local assessors to be the total taxable value of land and additions on the property. | Land | Improvement |
|---|---|---|---|---|
| 2024 | $1,638 | $75,096 | $16,446 | $58,650 |
| 2023 | $1,780 | $67,730 | $11,128 | $56,602 |
| 2022 | $2,010 | $67,730 | $11,128 | $56,602 |
| 2021 | $2,022 | $67,730 | $11,128 | $56,602 |
| 2020 | $2,061 | $67,730 | $11,128 | $56,602 |
| 2019 | $2,057 | $67,730 | $11,128 | $56,602 |
| 2018 | $1,831 | $67,730 | $11,128 | $56,602 |
| 2017 | $1,834 | $67,730 | $11,128 | $56,602 |
| 2016 | $1,835 | $67,730 | $11,128 | $56,602 |
| 2015 | $1,833 | $67,730 | $11,128 | $56,602 |
| 2014 | $1,834 | $67,730 | $11,128 | $56,602 |
| 2013 | -- | $67,730 | $11,128 | $56,602 |
Source: Public Records
Map
Nearby Homes
- 86 Owen Medford Rd
- 0 S Us Hwy 41 Lee Ball Rd Unit 134993
- 5015 Union Rd
- 0 E 0 Hwy 125 S
- 187 Bussell Rd
- 720 Vanceville County Line Rd
- 4716 Union Rd
- 69 Branch Ln
- 0 Union Industrial Way
- 350 Copeland Rd
- 2635 Brookfield-Lenox Rd
- 13 Amoco Rd
- 0 Baker Rd
- 39 Paradise Lake Rd
- 221 Rentz Bridge Rd
- 45 Surrey Cir
- 273 Vanceville County Line Rd
- 33 Surrey Cir
- 5 Paradise Lake Rd
- 4480 Union Rd
- 4220 Us Highway 41 S
- 4220 S Ga Hwy
- 4220 S Ga Hwy 41
- 4210 Us Highway 41 S
- 4234 Us Highway 41 S
- 4200 Us Highway 41 S
- 399 Owen Medford Rd
- 4199 Us Highway 41 S
- 24 Owen Medford Rd
- 8 Owen Medford Rd
- 4190 Us Highway 41 S
- 4176 Us Highway 41 S
- 4181 Us Highway 41 S
- 4170 Us Highway 41 S
- 4164 Us Highway 41 S
- 166 Williams Rd
- 74 Owen Medford Rd
- 4294 Us Highway 41 S
- 165 Williams Rd
- 4128 Us Highway 41 S