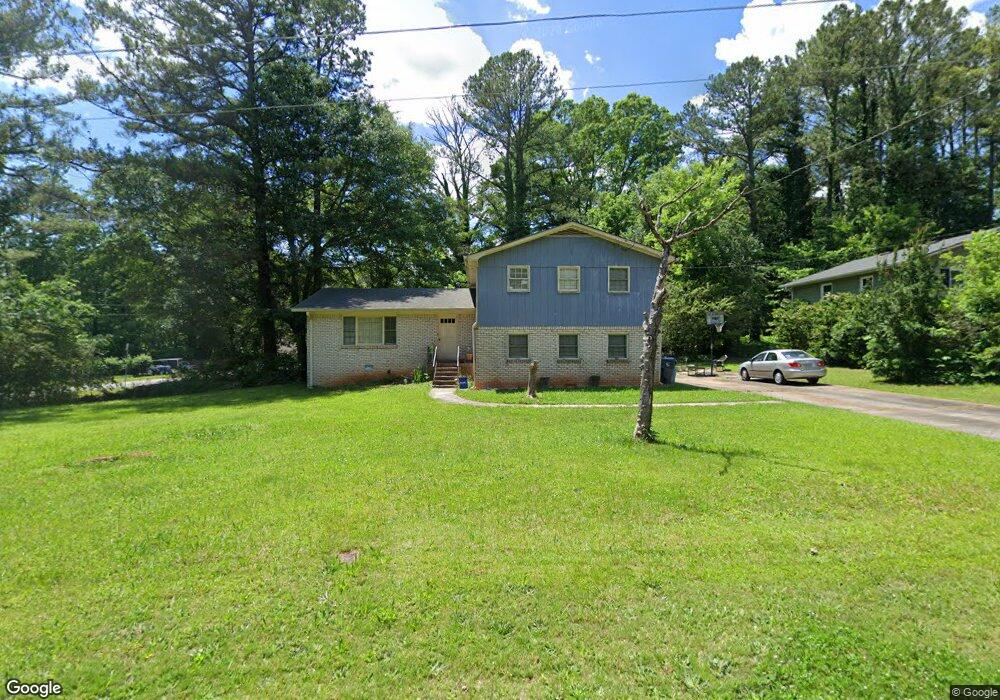
4221 Marsh Rd Marietta, GA 30066
Sandy Plains NeighborhoodEstimated Value: $355,640 - $389,000
3
Beds
2
Baths
1,600
Sq Ft
$232/Sq Ft
Est. Value
About This Home
This home is located at 4221 Marsh Rd, Marietta, GA 30066 and is currently estimated at $370,660, approximately $231 per square foot. 4221 Marsh Rd is a home located in Cobb County with nearby schools including Nicholson Elementary School, McCleskey Middle School, and The Garden School.
Ownership History
Date
Name
Owned For
Owner Type
Purchase Details
Closed on
Jul 12, 2021
Sold by
Early Timothy
Bought by
Early Timothy and Early Jackeline M
Current Estimated Value
Home Financials for this Owner
Home Financials are based on the most recent Mortgage that was taken out on this home.
Original Mortgage
$279,851
Outstanding Balance
$253,370
Interest Rate
2.9%
Mortgage Type
New Conventional
Estimated Equity
$117,290
Purchase Details
Closed on
Apr 1, 2021
Sold by
Meier Investments Lllp
Bought by
33H Real Estate Income Fund Vii Llc
Home Financials for this Owner
Home Financials are based on the most recent Mortgage that was taken out on this home.
Original Mortgage
$155,625
Interest Rate
2.8%
Mortgage Type
Commercial
Purchase Details
Closed on
Apr 25, 2017
Sold by
Meier Rosemarie
Bought by
Meier Investments Lllp
Purchase Details
Closed on
Mar 31, 1994
Sold by
Myers Patricia L
Bought by
Meier Rose Marie
Create a Home Valuation Report for This Property
The Home Valuation Report is an in-depth analysis detailing your home's value as well as a comparison with similar homes in the area
Home Values in the Area
Average Home Value in this Area
Purchase History
| Date | Buyer | Sale Price | Title Company |
|---|---|---|---|
| Early Timothy | -- | None Available | |
| Early Timothy | $294,600 | None Available | |
| 33H Real Estate Income Fund Vii Llc | $207,500 | None Available | |
| Meier Investments Lllp | -- | -- | |
| Meier Rose Marie | $70,300 | -- |
Source: Public Records
Mortgage History
| Date | Status | Borrower | Loan Amount |
|---|---|---|---|
| Open | Early Timothy | $279,851 | |
| Closed | Early Timothy | $279,851 | |
| Previous Owner | 33H Real Estate Income Fund Vii Llc | $155,625 |
Source: Public Records
Tax History Compared to Growth
Tax History
| Year | Tax Paid | Tax Assessment Tax Assessment Total Assessment is a certain percentage of the fair market value that is determined by local assessors to be the total taxable value of land and additions on the property. | Land | Improvement |
|---|---|---|---|---|
| 2025 | $3,445 | $123,340 | $26,880 | $96,460 |
| 2024 | $3,719 | $123,340 | $26,880 | $96,460 |
| 2023 | $3,822 | $126,764 | $26,880 | $99,884 |
| 2022 | $2,336 | $76,980 | $19,200 | $57,780 |
| 2021 | $2,336 | $76,980 | $19,200 | $57,780 |
| 2020 | $2,086 | $68,724 | $15,360 | $53,364 |
| 2019 | $2,086 | $68,724 | $15,360 | $53,364 |
| 2018 | $2,140 | $70,500 | $19,200 | $51,300 |
| 2017 | $1,690 | $58,784 | $19,200 | $39,584 |
| 2016 | $1,690 | $58,784 | $19,200 | $39,584 |
| 2015 | $1,320 | $44,796 | $18,400 | $26,396 |
| 2014 | $1,331 | $44,796 | $0 | $0 |
Source: Public Records
Map
Nearby Homes
- 4262 Inlet Rd
- 4413 Inlet Rd
- 4422 Inlet Rd
- 3980 Philmont Dr
- 1192 Pathfinder Rd
- 4108 Christacy Way
- 3886 Ebenezer Rd
- 1740 Latour Dr NE
- 1186 Lincoln Dr
- 1718 Christie Dr NE
- 3796 Hickory Ridge Ct
- 3920 Bellair Dr
- 4181 Keheley Dr NE
- 1528 Forest Trace
- 3935 Bellair Dr
- 3901 Bellair Dr
- 4281 Keheley Lake Dr NE
- 3909 Bellair Dr
- 4680 Jamerson Forest Pkwy
- 4231 Marsh Rd
- 4220 Marsh Rd
- 1330 Shallowford Rd
- 4241 Marsh Rd
- 4210 Marsh Rd
- 4240 Marsh Rd
- 4251 Marsh Rd
- 4023 Meadow Way
- 1365 Shallowford Rd
- 4250 Marsh Rd
- 4031 Meadow Way
- 4261 Marsh Rd
- 0 Meadow Way Unit 8693265
- 0 Meadow Way Unit 8357404
- 0 Meadow Way Unit 7224282
- 0 Meadow Way Unit 7055346
- 0 Meadow Way Unit 8736340
- 0 Meadow Way Unit 8841446
- 0 Meadow Way Unit 3134111
- 0 Meadow Way Unit 7241374