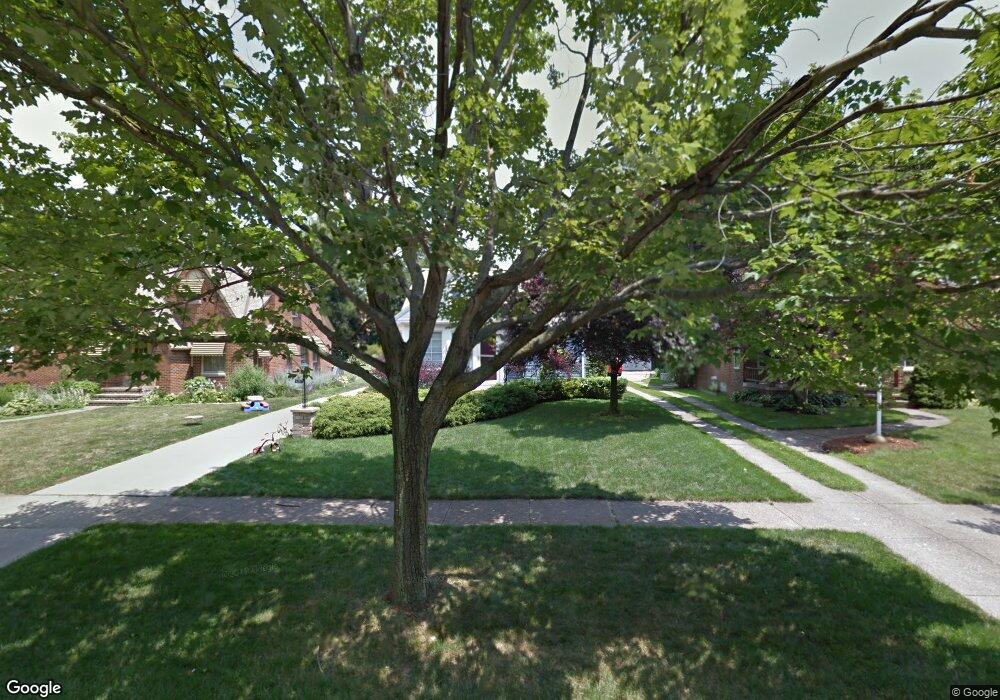
4221 W 214th St Cleveland, OH 44126
Estimated Value: $213,592 - $258,000
2
Beds
1
Bath
855
Sq Ft
$279/Sq Ft
Est. Value
About This Home
This home is located at 4221 W 214th St, Cleveland, OH 44126 and is currently estimated at $238,398, approximately $278 per square foot. 4221 W 214th St is a home located in Cuyahoga County with nearby schools including Gilles-Sweet Elementary School, Lewis F Mayer Middle School, and Fairview High School.
Ownership History
Date
Name
Owned For
Owner Type
Purchase Details
Closed on
May 12, 2025
Sold by
Nelson Lisa M and Zellmer Lisa M
Bought by
Zellmer Lisa M
Current Estimated Value
Home Financials for this Owner
Home Financials are based on the most recent Mortgage that was taken out on this home.
Original Mortgage
$172,000
Outstanding Balance
$171,387
Interest Rate
6.62%
Mortgage Type
New Conventional
Estimated Equity
$67,011
Purchase Details
Closed on
Aug 14, 2003
Sold by
Mark Thomas and Mark Julie
Bought by
Zellmer Eric M and Nelson Lisa M
Home Financials for this Owner
Home Financials are based on the most recent Mortgage that was taken out on this home.
Original Mortgage
$144,728
Interest Rate
5.47%
Mortgage Type
FHA
Purchase Details
Closed on
Jul 9, 1996
Sold by
Crowe Pearl A
Bought by
Mark Thomas and Mark Julie
Purchase Details
Closed on
Jan 1, 1975
Bought by
Crowe Pearl Armbruster
Create a Home Valuation Report for This Property
The Home Valuation Report is an in-depth analysis detailing your home's value as well as a comparison with similar homes in the area
Home Values in the Area
Average Home Value in this Area
Purchase History
| Date | Buyer | Sale Price | Title Company |
|---|---|---|---|
| Zellmer Lisa M | -- | None Listed On Document | |
| Zellmer Eric M | $147,000 | Guardian Title | |
| Mark Thomas | $100,000 | -- | |
| Crowe Pearl Armbruster | -- | -- |
Source: Public Records
Mortgage History
| Date | Status | Borrower | Loan Amount |
|---|---|---|---|
| Open | Zellmer Lisa M | $172,000 | |
| Previous Owner | Zellmer Eric M | $144,728 |
Source: Public Records
Tax History Compared to Growth
Tax History
| Year | Tax Paid | Tax Assessment Tax Assessment Total Assessment is a certain percentage of the fair market value that is determined by local assessors to be the total taxable value of land and additions on the property. | Land | Improvement |
|---|---|---|---|---|
| 2024 | $5,027 | $72,660 | $15,365 | $57,295 |
| 2023 | $4,977 | $61,710 | $13,760 | $47,950 |
| 2022 | $4,854 | $176,300 | $39,300 | $137,000 |
| 2021 | $4,954 | $61,710 | $13,760 | $47,950 |
| 2020 | $4,559 | $49,770 | $11,100 | $38,680 |
| 2019 | $4,054 | $142,200 | $31,700 | $110,500 |
| 2018 | $3,846 | $49,770 | $11,100 | $38,680 |
| 2017 | $3,811 | $43,190 | $9,940 | $33,250 |
| 2016 | $3,786 | $43,190 | $9,940 | $33,250 |
| 2015 | $3,574 | $43,190 | $9,940 | $33,250 |
| 2014 | $3,574 | $41,130 | $9,450 | $31,680 |
Source: Public Records
Map
Nearby Homes
- 4291 W 215th St
- 4243 W 212th St
- 21237 Westwood Rd
- 21143 Westwood Rd
- 4036 W 219th St
- 4140 W 220th St
- 21236 Northwood Ave
- 21503 Hillsdale Ave
- 4235 W 222nd St
- 20778 Woodstock Ave
- 3733 River Ln
- 22377 Rivergate Dr
- 20688 Belvidere Ave
- 21888 Eaton Rd
- 3826 W 210th St
- 4654 W 221st St
- 4627 W 223rd St
- 4267 W 226th St
- 3712 Addington Ct
- 3913 W 227th St
- 4213 W 214th St
- 4229 W 214th St
- 4205 W 214th St
- 4237 W 214th St
- 21280 Clifford Dr
- 4197 W 214th St
- 4338 W 212th St
- 4346 W 212th St
- 4189 W 214th St
- 4330 W 212th St
- 4245 W 214th St
- 4360 W 212th St
- 4181 W 214th St
- 4314 W 212th St
- 4253 W 214th St
- 4220 W 214th St
- 4212 W 214th St
- 4228 W 214th St
- 4306 W 212th St