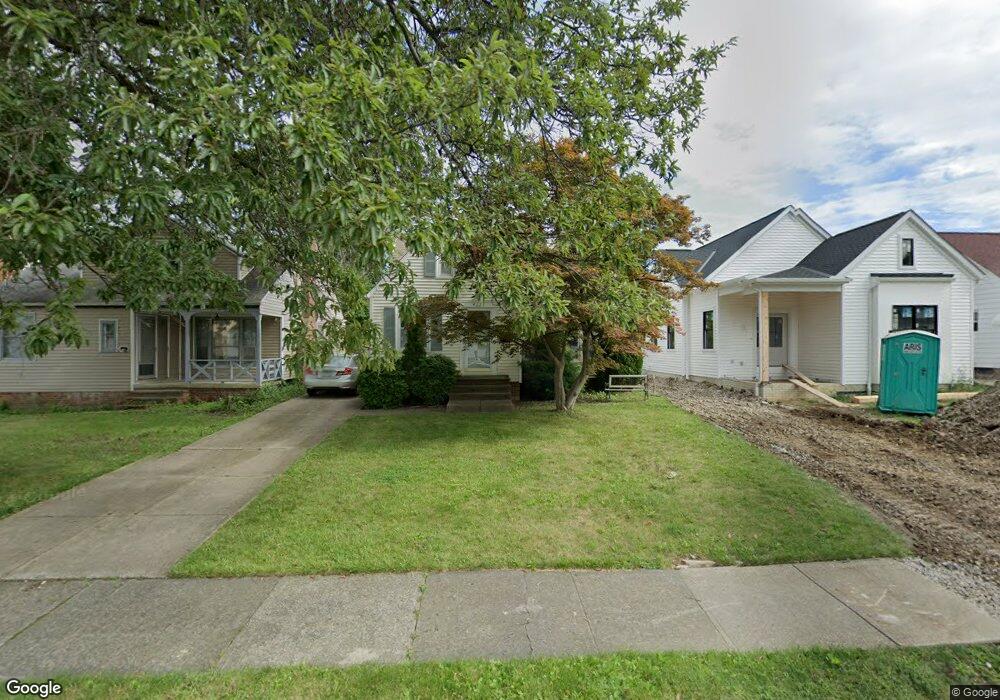
4221 Wilmington Rd Cleveland, OH 44121
Estimated Value: $154,000 - $167,000
2
Beds
1
Bath
1,322
Sq Ft
$121/Sq Ft
Est. Value
About This Home
This home is located at 4221 Wilmington Rd, Cleveland, OH 44121 and is currently estimated at $160,235, approximately $121 per square foot. 4221 Wilmington Rd is a home located in Cuyahoga County with nearby schools including Rowland Elementary School, Greenview Upper Elementary School, and Memorial Junior High School.
Ownership History
Date
Name
Owned For
Owner Type
Purchase Details
Closed on
Oct 31, 1996
Sold by
Harnden Sherri L
Bought by
Harnden Susan
Current Estimated Value
Home Financials for this Owner
Home Financials are based on the most recent Mortgage that was taken out on this home.
Original Mortgage
$57,600
Interest Rate
8.23%
Mortgage Type
New Conventional
Purchase Details
Closed on
May 12, 1993
Sold by
Harnden Sherri L
Bought by
Harnden Sherri L
Purchase Details
Closed on
Jul 6, 1989
Sold by
Lange Jeffrey
Bought by
Harnden Sherri L
Purchase Details
Closed on
Mar 20, 1981
Sold by
Tricarichi Anthony J
Bought by
Lange Jeffrey
Purchase Details
Closed on
Jul 28, 1978
Sold by
Adelstein Celia
Bought by
Tricarichi Anthony J
Purchase Details
Closed on
Dec 31, 1975
Sold by
Adelstien Harry and Adelstien Celia
Bought by
Adelstein Celia
Purchase Details
Closed on
Jan 1, 1975
Bought by
Adelstien Harry and Adelstien Celia
Create a Home Valuation Report for This Property
The Home Valuation Report is an in-depth analysis detailing your home's value as well as a comparison with similar homes in the area
Home Values in the Area
Average Home Value in this Area
Purchase History
| Date | Buyer | Sale Price | Title Company |
|---|---|---|---|
| Harnden Susan | $72,000 | -- | |
| Harnden Sherri L | -- | -- | |
| Harnden Sherri L | $54,000 | -- | |
| Lange Jeffrey | $51,000 | -- | |
| Tricarichi Anthony J | $40,000 | -- | |
| Adelstein Celia | -- | -- | |
| Adelstien Harry | -- | -- |
Source: Public Records
Mortgage History
| Date | Status | Borrower | Loan Amount |
|---|---|---|---|
| Previous Owner | Harnden Susan | $57,600 |
Source: Public Records
Tax History Compared to Growth
Tax History
| Year | Tax Paid | Tax Assessment Tax Assessment Total Assessment is a certain percentage of the fair market value that is determined by local assessors to be the total taxable value of land and additions on the property. | Land | Improvement |
|---|---|---|---|---|
| 2024 | $3,716 | $47,950 | $9,835 | $38,115 |
| 2023 | $3,399 | $35,420 | $7,140 | $28,280 |
| 2022 | $3,381 | $35,420 | $7,140 | $28,280 |
| 2021 | $3,356 | $35,420 | $7,140 | $28,280 |
| 2020 | $3,142 | $28,810 | $5,810 | $23,000 |
| 2019 | $2,873 | $82,300 | $16,600 | $65,700 |
| 2018 | $2,635 | $28,350 | $5,810 | $22,540 |
| 2017 | $2,526 | $23,030 | $4,760 | $18,270 |
| 2016 | $2,510 | $23,030 | $4,760 | $18,270 |
| 2015 | $2,553 | $23,030 | $4,760 | $18,270 |
| 2014 | $2,553 | $24,260 | $5,010 | $19,250 |
Source: Public Records
Map
Nearby Homes
- 4210 Stonehaven Rd
- 4194 Stilmore Rd
- 4237 Verona Rd
- 4233 Bayard Rd
- 4206 Verona Rd
- 4124 Bayard Rd
- 1940 Temblethurst Rd
- 4158 Wyncote Rd
- 4121 Hinsdale Rd
- 1895 Temblethurst Rd
- 4201 Lambert Rd
- 4033 Stonehaven Rd
- 4040 Bayard Rd
- 4197 Okalona Rd
- 4154 Bexley Blvd
- 4015 Bayard Rd
- 1819 Warrensville Center Rd
- 2108 S Belvoir Blvd
- 2091 S Belvoir Blvd
- 14213 Cedar Rd
- 4225 Wilmington Rd
- 4217 Wilmington Rd
- 4229 Wilmington Rd
- 4213 Wilmington Rd
- 4233 Wilmington Rd
- 4209 Wilmington Rd
- 4222 Stonehaven Rd
- 4226 Stonehaven Rd
- 4218 Stonehaven Rd
- 4230 Stonehaven Rd
- 4214 Stonehaven Rd
- 4237 Wilmington Rd
- 4205 Wilmington Rd
- 4234 Stonehaven Rd
- 4222 Wilmington Rd
- 4226 Wilmington Rd
- 4218 Wilmington Rd
- 4230 Wilmington Rd
- 4214 Wilmington Rd
- 4201 Wilmington Rd