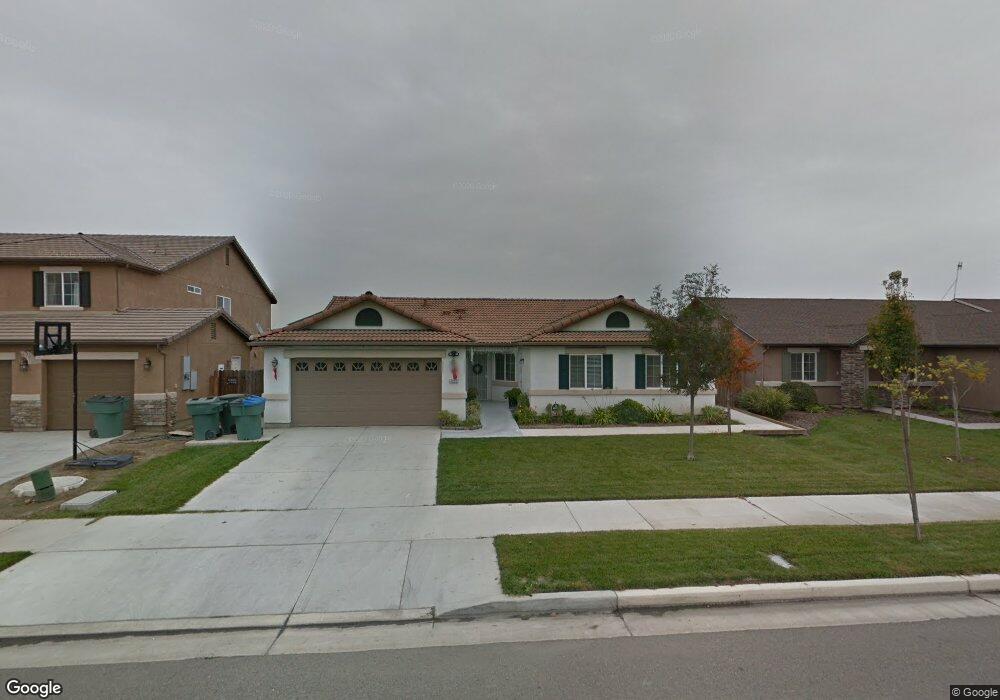
4222 S Rova St Visalia, CA 93277
Estimated Value: $403,634 - $454,000
--
Bed
--
Bath
1,827
Sq Ft
$235/Sq Ft
Est. Value
About This Home
This home is located at 4222 S Rova St, Visalia, CA 93277 and is currently estimated at $430,159, approximately $235 per square foot. 4222 S Rova St is a home located in Tulare County with nearby schools including Cottonwood Creek Elementary School, La Joya Middle School, and El Diamante High School.
Ownership History
Date
Name
Owned For
Owner Type
Purchase Details
Closed on
Jul 28, 2021
Sold by
Pira Jose A
Bought by
Pira Jose A
Current Estimated Value
Home Financials for this Owner
Home Financials are based on the most recent Mortgage that was taken out on this home.
Original Mortgage
$246,000
Outstanding Balance
$189,342
Interest Rate
2.93%
Mortgage Type
New Conventional
Estimated Equity
$240,817
Purchase Details
Closed on
Jul 10, 2007
Sold by
Pira Brigette R
Bought by
Pira Jose A
Home Financials for this Owner
Home Financials are based on the most recent Mortgage that was taken out on this home.
Original Mortgage
$305,000
Interest Rate
6.51%
Mortgage Type
Purchase Money Mortgage
Purchase Details
Closed on
Mar 6, 2006
Sold by
Centex Homes
Bought by
Pira Jose
Home Financials for this Owner
Home Financials are based on the most recent Mortgage that was taken out on this home.
Original Mortgage
$208,043
Interest Rate
6.76%
Mortgage Type
Purchase Money Mortgage
Create a Home Valuation Report for This Property
The Home Valuation Report is an in-depth analysis detailing your home's value as well as a comparison with similar homes in the area
Home Values in the Area
Average Home Value in this Area
Purchase History
| Date | Buyer | Sale Price | Title Company |
|---|---|---|---|
| Pira Jose A | -- | Chicago Title Company | |
| Pira Jose A | -- | First American Title Co | |
| Pira Jose A | -- | First American Title Co | |
| Pira Jose | $260,500 | Commerce Title Company |
Source: Public Records
Mortgage History
| Date | Status | Borrower | Loan Amount |
|---|---|---|---|
| Open | Pira Jose A | $246,000 | |
| Closed | Pira Jose A | $305,000 | |
| Previous Owner | Pira Jose | $208,043 |
Source: Public Records
Tax History Compared to Growth
Tax History
| Year | Tax Paid | Tax Assessment Tax Assessment Total Assessment is a certain percentage of the fair market value that is determined by local assessors to be the total taxable value of land and additions on the property. | Land | Improvement |
|---|---|---|---|---|
| 2025 | $3,912 | $355,583 | $147,377 | $208,206 |
| 2024 | $3,912 | $348,612 | $144,488 | $204,124 |
| 2023 | $3,810 | $341,777 | $141,655 | $200,122 |
| 2022 | $3,699 | $335,077 | $138,878 | $196,199 |
| 2021 | $3,351 | $300,000 | $75,000 | $225,000 |
| 2020 | $2,863 | $253,000 | $63,000 | $190,000 |
| 2019 | $2,919 | $261,000 | $65,000 | $196,000 |
| 2018 | $2,761 | $247,000 | $62,000 | $185,000 |
| 2017 | $2,653 | $237,000 | $59,000 | $178,000 |
| 2016 | $2,468 | $219,000 | $55,000 | $164,000 |
| 2015 | $2,151 | $207,000 | $52,000 | $155,000 |
| 2014 | $2,151 | $188,000 | $47,000 | $141,000 |
Source: Public Records
Map
Nearby Homes
- 4228 S Julieann Ct
- 4924 W Elkhorn Ave
- 4038 S Atwood St
- 4105 W Concord Ct
- 4036 W Rialto Ave
- 4218 W Redding Ave
- 4024 S Parkwood St
- 3933 S Parkwood St
- 3335 W Florence Ave
- 3346 W Good Ave
- 4537 S Ernest St
- 27387 Road 100
- 4302 S Chatham St
- 4247 S University St
- 4246 S University St
- 2223 S Julieann St Unit 1032v
- 2346 S Julieann St Unit 1067v
- 4250 S Silvervale St
- 3432 W Good Ave
- 4303 S Chatham St
- 4210 S Rova St
- 4234 S Rova St
- 4200 S Rova St
- 4244 S Rova St
- 4631 W Elkhorn Ave
- 4634 W Reese Ave
- 4150 S Rova St
- 4466 W Westmont Ave
- 4643 W Elkhorn Ave
- 4250 S Rova St
- 4642 W Reese Ave
- 4142 S Rova St
- 4211 S Bollinger Ct
- 4630 W Elkhorn Ave
- 4223 S Bollinger Ct
- 4458 W Westmont Ave
- 4463 W Elkhorn Ave
- 4621 W Reese Ave
- 4651 W Elkhorn Ave
- 4633 W Reese Ave