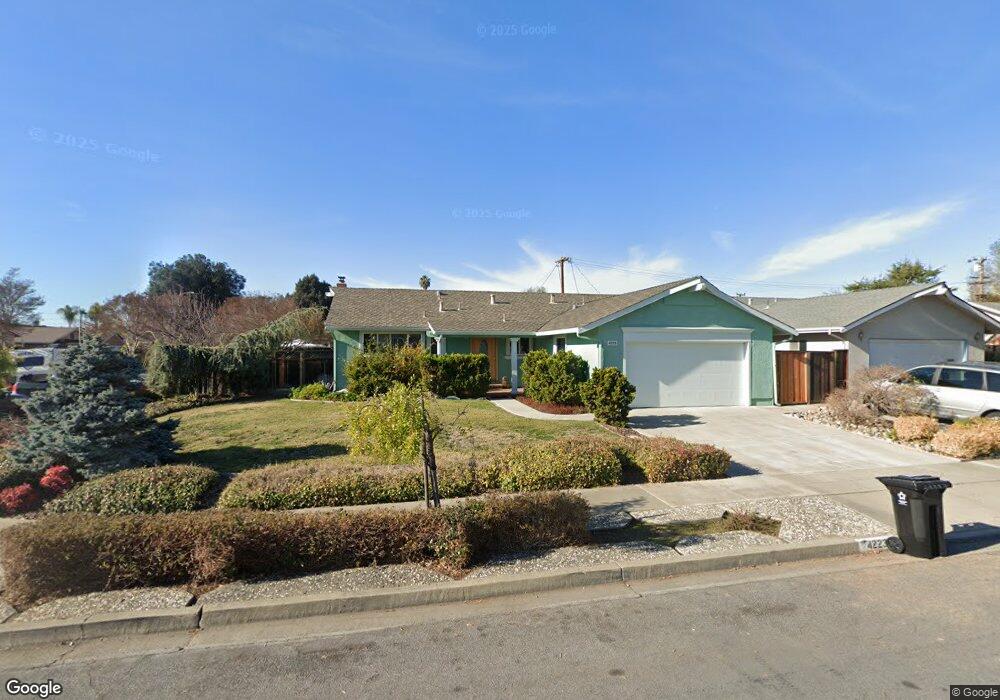
4223 Patricia St Fremont, CA 94536
Glenmoor NeighborhoodEstimated Value: $1,377,381 - $1,722,000
3
Beds
2
Baths
1,344
Sq Ft
$1,207/Sq Ft
Est. Value
About This Home
This home is located at 4223 Patricia St, Fremont, CA 94536 and is currently estimated at $1,622,595, approximately $1,207 per square foot. 4223 Patricia St is a home located in Alameda County with nearby schools including Tom Maloney Elementary School, Centerville Junior High School, and Washington High School.
Ownership History
Date
Name
Owned For
Owner Type
Purchase Details
Closed on
Mar 5, 2017
Sold by
Gearhart Michael James and Gearhart Anne Marie
Bought by
Gearhart Michael James and Gearhart Anne Marie
Current Estimated Value
Purchase Details
Closed on
Aug 22, 1996
Sold by
Barash Dorothy A
Bought by
Gearhart Michael and Gearhart Anne Marie
Home Financials for this Owner
Home Financials are based on the most recent Mortgage that was taken out on this home.
Original Mortgage
$207,000
Outstanding Balance
$16,392
Interest Rate
8.23%
Estimated Equity
$1,606,203
Purchase Details
Closed on
May 30, 1996
Sold by
Barash Dorothy A
Bought by
Barash Dorothy A and Dorothy Barash Trust
Purchase Details
Closed on
Sep 19, 1994
Sold by
Gardner Pearl F
Bought by
Gardner Pearl F and Barash Dorothy A
Create a Home Valuation Report for This Property
The Home Valuation Report is an in-depth analysis detailing your home's value as well as a comparison with similar homes in the area
Home Values in the Area
Average Home Value in this Area
Purchase History
| Date | Buyer | Sale Price | Title Company |
|---|---|---|---|
| Gearhart Michael James | -- | None Available | |
| Gearhart Michael James | -- | None Available | |
| Gearhart Michael | $219,000 | North American Title Co | |
| Barash Dorothy A | -- | -- | |
| Gardner Pearl F | $210,000 | North American Title Company | |
| Gardner Pearl F | $210,000 | North American Title Company |
Source: Public Records
Mortgage History
| Date | Status | Borrower | Loan Amount |
|---|---|---|---|
| Open | Gearhart Michael | $207,000 |
Source: Public Records
Tax History Compared to Growth
Tax History
| Year | Tax Paid | Tax Assessment Tax Assessment Total Assessment is a certain percentage of the fair market value that is determined by local assessors to be the total taxable value of land and additions on the property. | Land | Improvement |
|---|---|---|---|---|
| 2025 | $4,742 | $353,142 | $106,998 | $253,144 |
| 2024 | $4,742 | $346,081 | $104,900 | $248,181 |
| 2023 | $4,601 | $346,160 | $102,844 | $243,316 |
| 2022 | $4,522 | $332,372 | $100,827 | $238,545 |
| 2021 | $4,415 | $325,718 | $98,850 | $233,868 |
| 2020 | $4,365 | $329,308 | $97,837 | $231,471 |
| 2019 | $4,318 | $322,854 | $95,920 | $226,934 |
| 2018 | $4,230 | $316,524 | $94,039 | $222,485 |
| 2017 | $4,124 | $310,320 | $92,196 | $218,124 |
| 2016 | $4,009 | $301,295 | $90,388 | $210,907 |
| 2015 | $3,946 | $296,770 | $89,031 | $207,739 |
| 2014 | $3,870 | $290,958 | $87,287 | $203,671 |
Source: Public Records
Map
Nearby Homes
- 4328 Cognina Ct
- 38265 Corrigan Ct
- 4237 Garland Dr
- 3810 Burton Common
- 3833 Burton Common
- 38837 Fremont Blvd
- 38030 Dundee Common
- 4586 Norris Rd
- 38611 Country Common
- 4715 Eggers Dr
- 39090 Presidio Way Unit 237
- 4754 Northdale Dr
- 37637 Canterbury St
- 3006 Eggers Dr
- 39134 Memorial St
- Plan 1629 at Veranda
- Plan 1165 at Veranda
- Plan 1670 at Veranda
- Plan 1455 at Veranda
- Plan 1394 at Veranda
- 4215 Patricia St
- 38452 Darnel Ct
- 38448 Darnel Ct
- 4363 Corrigan Dr
- 4375 Corrigan Dr
- 4207 Patricia St
- 4228 Patricia St
- 4220 Patricia St
- 38444 Darnel Ct
- 4351 Corrigan Dr
- 4387 Corrigan Dr
- 4208 Patricia St
- 4236 Patricia St
- 4193 Patricia St
- 4339 Corrigan Dr
- 38439 Darnel Ct
- 4200 Patricia St
- 38420 Dennis Ct
- 4235 Canfield Dr
- 4253 Canfield Dr