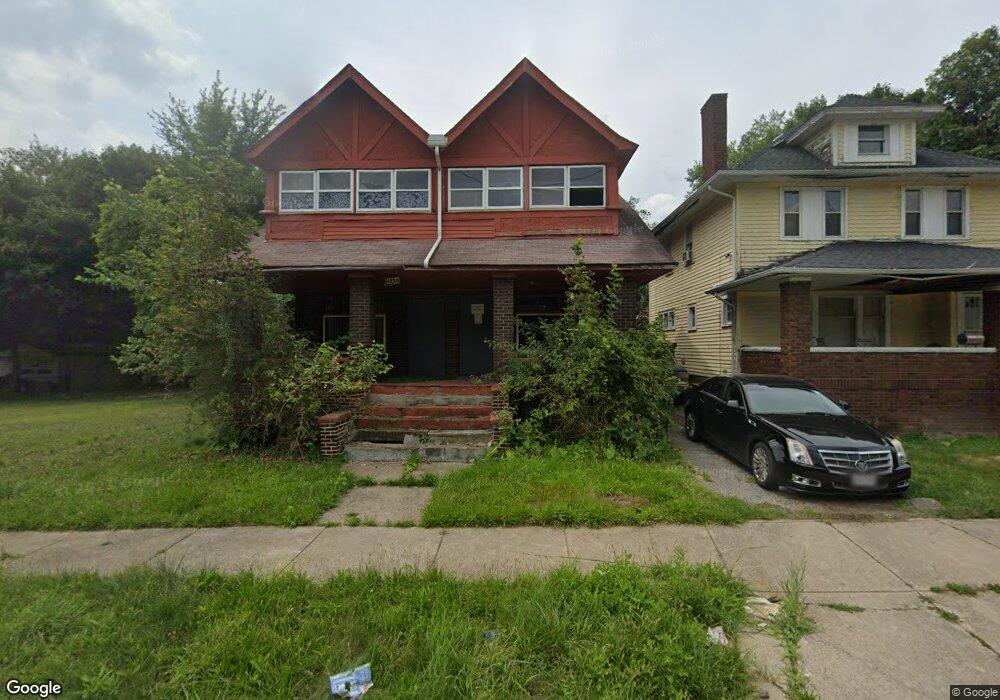
4224 E 110th St Cleveland, OH 44105
Union-Miles Park NeighborhoodEstimated Value: $44,000 - $104,000
4
Beds
2
Baths
2,420
Sq Ft
$35/Sq Ft
Est. Value
About This Home
This home is located at 4224 E 110th St, Cleveland, OH 44105 and is currently estimated at $83,667, approximately $34 per square foot. 4224 E 110th St is a home located in Cuyahoga County with nearby schools including Andrew J. Rickoff School, Adlai Stevenson School, and Anton Grdina School.
Ownership History
Date
Name
Owned For
Owner Type
Purchase Details
Closed on
Sep 17, 2024
Sold by
Cuyahoga County Land Reutilization Corpo
Bought by
City Of Cleveland Land Reutilization Program
Current Estimated Value
Purchase Details
Closed on
May 15, 2022
Sold by
Moore Billy
Bought by
Garner Ashley
Purchase Details
Closed on
Jun 15, 1990
Sold by
Randle Onzo
Bought by
Moore Billy J
Purchase Details
Closed on
Apr 21, 1989
Bought by
Randle Onzo
Purchase Details
Closed on
Jan 6, 1989
Sold by
Latham Brenda M
Bought by
Secretary Of H.U.D. 989607
Purchase Details
Closed on
Jul 8, 1985
Sold by
Parkham Brenda M
Bought by
Latham Brenda M
Purchase Details
Closed on
May 31, 1984
Sold by
Kirkwood Earl W and Kirkwood Mildred
Bought by
Parkham Brenda M
Purchase Details
Closed on
Oct 16, 1981
Sold by
Gramp Gerhard
Bought by
Kirkwood Earl W and Kirkwood Mildred
Purchase Details
Closed on
Jan 1, 1975
Bought by
Gramp Gerhard
Create a Home Valuation Report for This Property
The Home Valuation Report is an in-depth analysis detailing your home's value as well as a comparison with similar homes in the area
Home Values in the Area
Average Home Value in this Area
Purchase History
| Date | Buyer | Sale Price | Title Company |
|---|---|---|---|
| City Of Cleveland Land Reutilization Program | -- | None Listed On Document | |
| Garner Ashley | $37,100 | Moore Billy | |
| Moore Billy J | $45,000 | -- | |
| Randle Onzo | -- | -- | |
| Secretary Of H.U.D. 989607 | -- | -- | |
| Latham Brenda M | -- | -- | |
| Parkham Brenda M | $33,000 | -- | |
| Kirkwood Earl W | $13,000 | -- | |
| Gramp Gerhard | -- | -- |
Source: Public Records
Tax History Compared to Growth
Tax History
| Year | Tax Paid | Tax Assessment Tax Assessment Total Assessment is a certain percentage of the fair market value that is determined by local assessors to be the total taxable value of land and additions on the property. | Land | Improvement |
|---|---|---|---|---|
| 2024 | $115 | $1,715 | $1,715 | -- |
| 2023 | $1,007 | $12,990 | $1,720 | $11,270 |
| 2022 | $989 | $12,985 | $1,715 | $11,270 |
| 2021 | $1,356 | $12,990 | $1,720 | $11,270 |
| 2020 | $1,333 | $11,200 | $1,470 | $9,730 |
| 2019 | $904 | $32,000 | $4,200 | $27,800 |
| 2018 | $1,103 | $11,200 | $1,470 | $9,730 |
| 2017 | $765 | $9,180 | $1,230 | $7,950 |
| 2016 | $759 | $9,180 | $1,230 | $7,950 |
| 2015 | $896 | $9,180 | $1,230 | $7,950 |
| 2014 | $896 | $10,790 | $1,440 | $9,350 |
Source: Public Records
Map
Nearby Homes
- 4221 E 112th St
- 4155 E 111th St
- 4119 E 111th St
- 4137 E 102nd St
- 4251 E 114th St
- 4234 E 116th St
- 4127 E 100th St
- 4112 E 114th St
- 4219 E 116th St
- 11624 Miles Ave
- 4313 E 116th St
- 11704 Robertson Ave
- 4139 E 97th St
- 9607 Pratt Ave
- 4154 E 95th St
- 4259 E 94th St
- 10709 Avon Ave
- 11927 Minor Ave
- 11402 Avon Ave
- 10225 Avon Ave
- 4220 E 110th St
- 4228 E 110th St
- 4232 E 110th St
- 10728 Elmarge Ave
- 10730 Elmarge Ave
- 4236 E 110th St
- 10914 Miles Ave
- 10724 Elmarge Ave
- 4221 E 110th St
- 4227 E 110th St
- 4231 E 110th St
- 4219 E 110th St
- 10714 Elmarge Ave
- 4235 E 110th St
- 10910 Miles Ave
- 10712 Elmarge Ave
- 11002 Miles Ave
- 4237 E 110th St
- 10802 Miles Ave
- 11006 Miles Ave