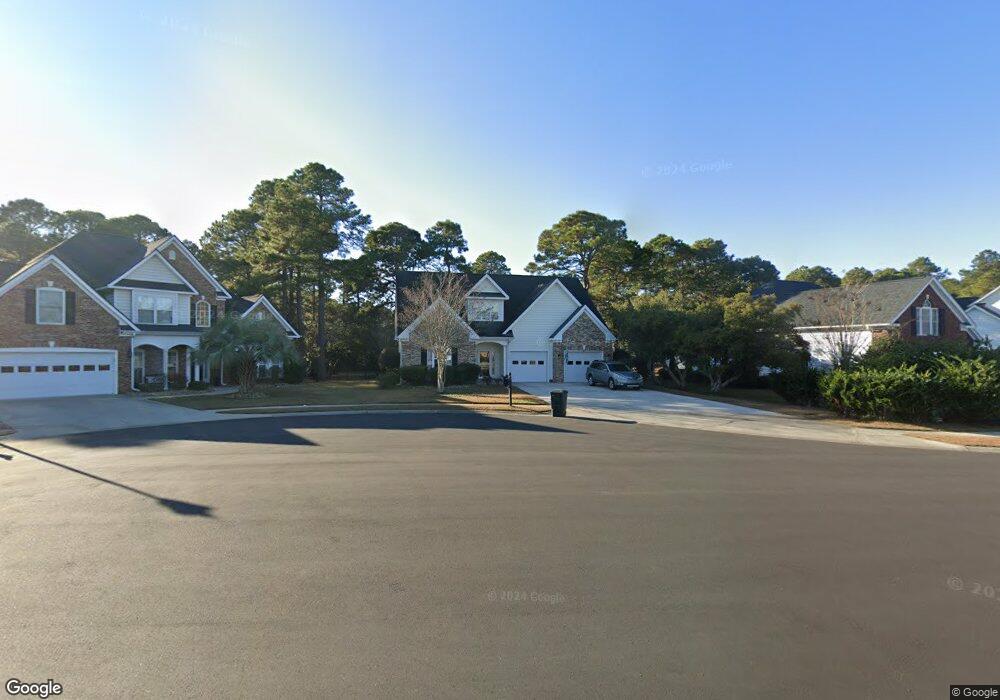
4224 Pointer Ct Unit Waterford Plantation Myrtle Beach, SC 29579
Estimated Value: $389,739 - $451,000
4
Beds
3
Baths
2,197
Sq Ft
$193/Sq Ft
Est. Value
About This Home
This home is located at 4224 Pointer Ct Unit Waterford Plantation, Myrtle Beach, SC 29579 and is currently estimated at $424,185, approximately $193 per square foot. 4224 Pointer Ct Unit Waterford Plantation is a home located in Horry County with nearby schools including Carolina Forest Elementary School, Ten Oaks Middle, and Carolina Forest High School.
Ownership History
Date
Name
Owned For
Owner Type
Purchase Details
Closed on
Jun 14, 2022
Sold by
Salter Richard M
Bought by
Moore Cory and Moore Dawn
Current Estimated Value
Home Financials for this Owner
Home Financials are based on the most recent Mortgage that was taken out on this home.
Original Mortgage
$305,200
Outstanding Balance
$289,965
Interest Rate
5.1%
Mortgage Type
New Conventional
Estimated Equity
$134,220
Purchase Details
Closed on
Mar 30, 2004
Sold by
Hodges James T
Bought by
Salter Richard M and Salter Susan M
Home Financials for this Owner
Home Financials are based on the most recent Mortgage that was taken out on this home.
Original Mortgage
$185,000
Interest Rate
5.54%
Mortgage Type
Purchase Money Mortgage
Purchase Details
Closed on
Jul 2, 2003
Sold by
Waterford Plantation Llc
Bought by
Hodges James T
Home Financials for this Owner
Home Financials are based on the most recent Mortgage that was taken out on this home.
Original Mortgage
$184,450
Interest Rate
5.2%
Mortgage Type
Construction
Create a Home Valuation Report for This Property
The Home Valuation Report is an in-depth analysis detailing your home's value as well as a comparison with similar homes in the area
Home Values in the Area
Average Home Value in this Area
Purchase History
| Date | Buyer | Sale Price | Title Company |
|---|---|---|---|
| Moore Cory | $381,500 | -- | |
| Salter Richard M | $235,100 | -- | |
| Hodges James T | $38,000 | -- |
Source: Public Records
Mortgage History
| Date | Status | Borrower | Loan Amount |
|---|---|---|---|
| Open | Moore Cory | $305,200 | |
| Previous Owner | Salter Richard M | $185,000 | |
| Previous Owner | Hodges James T | $184,450 |
Source: Public Records
Tax History Compared to Growth
Tax History
| Year | Tax Paid | Tax Assessment Tax Assessment Total Assessment is a certain percentage of the fair market value that is determined by local assessors to be the total taxable value of land and additions on the property. | Land | Improvement |
|---|---|---|---|---|
| 2024 | $5,285 | $17,236 | $4,000 | $13,236 |
| 2023 | $5,285 | $16,320 | $3,546 | $12,774 |
| 2021 | $3,561 | $16,320 | $3,546 | $12,774 |
| 2020 | $3,392 | $16,320 | $3,546 | $12,774 |
| 2019 | $3,392 | $16,320 | $3,546 | $12,774 |
| 2018 | $3,073 | $15,240 | $2,358 | $12,882 |
| 2017 | $0 | $10,160 | $1,572 | $8,588 |
| 2016 | $0 | $10,160 | $1,572 | $8,588 |
| 2015 | -- | $10,160 | $1,572 | $8,588 |
| 2014 | $29 | $10,160 | $1,572 | $8,588 |
Source: Public Records
Map
Nearby Homes
- 4190 Setter Ct
- 4818 Harvest Dr
- 4715 Harvest Dr
- 4800 New Haven Ct
- 4920 Windsor Green Way Unit 302
- 4930 Windsor Green Way Unit 301
- 3112 Bayhaven Dr
- 4909 Britewater Ct Unit 202
- 4907 Britewater Ct Unit 102
- 4920 Twin Pond Ct Unit CT202
- 4917 Twin Pond Ct Unit 102
- 463 Springlake Dr
- 4980 Windsor Green Way Unit 101
- 4913 Twin Pond Ct Unit 202
- 7021 Woodsong Dr
- 105 Ashley Park Dr Unit 2-E
- 5000 Windsor Green Way Unit 202
- 5000 Windsor Green Way Unit 204
- 113 Ashley Park Dr Unit 4A
- 113 Ashley Park Dr Unit 4 C
- 4224 Pointer Ct
- 4216 Pointer Ct
- 4240 Pointer Ct
- 4208 Pointer Ct
- 4183 Setter Ct
- 4179 Setter Ct Unit MB
- 4187 Setter Ct
- 4225 Pointer Ct Unit Waterford Plantation
- 4225 Pointer Ct
- 4241 Pointer Ct
- 4233 Pointer Ct
- 4217 Pointer Ct
- 4200 Pointer Ct
- 4175 Setter Ct
- 3020 Bayhaven Dr
- 166 Setter Ct
- 4209 Pointer Ct Unit Waterford Plantation
- 4209 Pointer Ct
- 4795 Seabreeze Ln
- 4795 Seabreeze Ln Unit Waterford Plantation