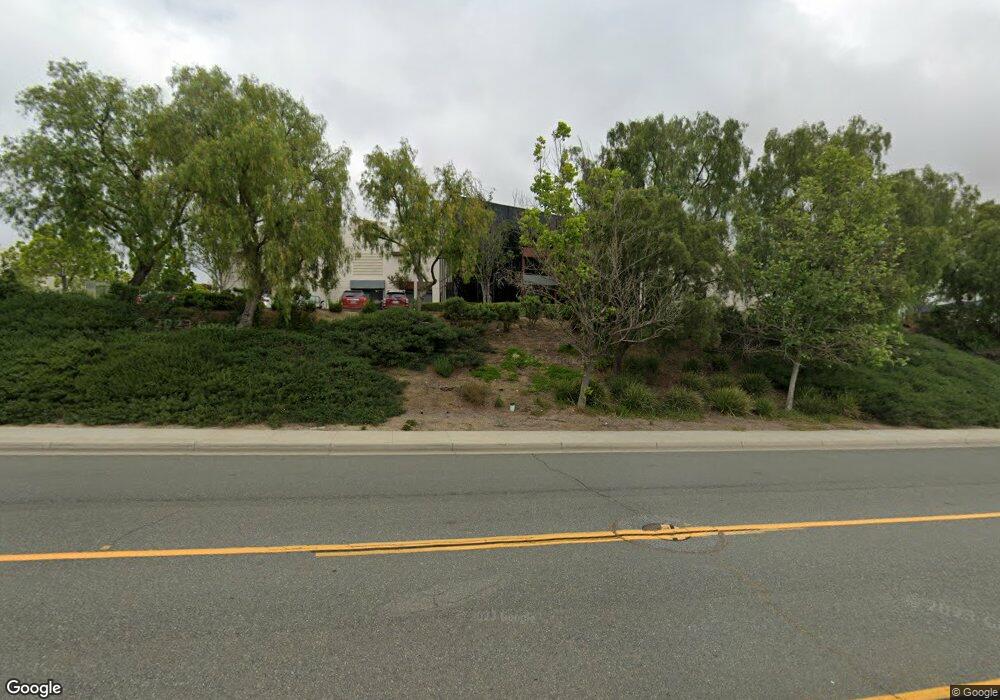
42245 Remington Ave Unit B1 Temecula, CA 92590
--
Bed
--
Bath
3,219
Sq Ft
3,049
Sq Ft Lot
About This Home
This home is located at 42245 Remington Ave Unit B1, Temecula, CA 92590. 42245 Remington Ave Unit B1 is a home located in Riverside County with nearby schools including Vail Elementary School, Margarita Middle School, and Temecula Valley High School.
Ownership History
Date
Name
Owned For
Owner Type
Purchase Details
Closed on
May 26, 2022
Sold by
Born Mark L and Born Laila M
Bought by
Born Mark L
Home Financials for this Owner
Home Financials are based on the most recent Mortgage that was taken out on this home.
Original Mortgage
$310,000
Outstanding Balance
$294,526
Interest Rate
5.1%
Mortgage Type
New Conventional
Purchase Details
Closed on
Dec 29, 2009
Sold by
General Electric Credit Equities Inc
Bought by
Born Mark L and Born Laila M
Home Financials for this Owner
Home Financials are based on the most recent Mortgage that was taken out on this home.
Original Mortgage
$129,280
Interest Rate
4.78%
Mortgage Type
Commercial
Purchase Details
Closed on
Jun 25, 2009
Sold by
Vcc Temecula Limited Partnership
Bought by
General Electric Credit Equities Inc
Create a Home Valuation Report for This Property
The Home Valuation Report is an in-depth analysis detailing your home's value as well as a comparison with similar homes in the area
Home Values in the Area
Average Home Value in this Area
Purchase History
| Date | Buyer | Sale Price | Title Company |
|---|---|---|---|
| Born Mark L | -- | None Listed On Document | |
| Born Mark L | -- | None Available | |
| General Electric Credit Equities Inc | $5,800,000 | First American Title Ins Co |
Source: Public Records
Mortgage History
| Date | Status | Borrower | Loan Amount |
|---|---|---|---|
| Open | Born Mark L | $310,000 | |
| Previous Owner | Born Mark L | $129,280 |
Source: Public Records
Tax History Compared to Growth
Tax History
| Year | Tax Paid | Tax Assessment Tax Assessment Total Assessment is a certain percentage of the fair market value that is determined by local assessors to be the total taxable value of land and additions on the property. | Land | Improvement |
|---|---|---|---|---|
| 2025 | $4,144 | $320,150 | $143,738 | $176,412 |
| 2024 | $4,144 | $313,873 | $140,920 | $172,953 |
| 2023 | $4,144 | $307,719 | $138,157 | $169,562 |
| 2022 | $4,026 | $301,687 | $135,449 | $166,238 |
| 2021 | $3,951 | $295,773 | $132,794 | $162,979 |
| 2020 | $3,913 | $292,741 | $131,433 | $161,308 |
| 2019 | $3,856 | $287,002 | $128,856 | $158,146 |
| 2018 | $3,788 | $281,376 | $126,331 | $155,045 |
| 2017 | $3,724 | $275,859 | $123,854 | $152,005 |
| 2016 | $3,652 | $270,451 | $121,426 | $149,025 |
| 2015 | $3,591 | $266,391 | $119,603 | $146,788 |
| 2014 | $3,496 | $261,174 | $117,261 | $143,913 |
Source: Public Records
Map
Nearby Homes
- 26780 Camino Seco
- 0 Camino Seco
- 888 Vía Vueltas
- 43110 Palomino Cir
- 28180 Jefferson Ave
- 28282 Sycamore Mesa Rd
- 40232 Via Orujo
- 28563 Via Navarra
- 28576 Via Navarra
- 28514 Via Crianza
- 28519 Via Crianza
- 28467 Via Rioja
- 28485 Via Rioja
- 26147 Douglass Ave
- 28474 Via Rioja
- 28550 Via Prago
- 28401 Campos de Flores
- 28597 Via Rueda
- 28419 Campos de Flores
- 28425 Campos de Flores
- 42245 Remington Ave
- 42245 Remington Ave Unit B-2
- 42245 Remington Ave Unit B4
- 42245 Remington Ave Unit B6
- 42245 Remington Ave Unit B-3
- 42245 Remington Ave Unit B-5
- 42245 Remington Ave Unit B-7
- 42245 Remington Ave Unit B11
- 42225 Remington Ave Unit A17
- 42225 Remington Ave
- 42225 Remington Ave Unit A-3
- 42225 Remington Ave Unit A-2
- 42225 Remington Ave Unit A-8
- 42225 Remington Ave Unit A-6
- 42225 Remington Ave Unit A-9
- 42225 Remington Ave Unit A-7
- 42225 Remington Ave Unit A10
- 42225 Remington Ave Unit A-18
- 42225 Remington Ave Unit A21
- 42075 Remington Ave