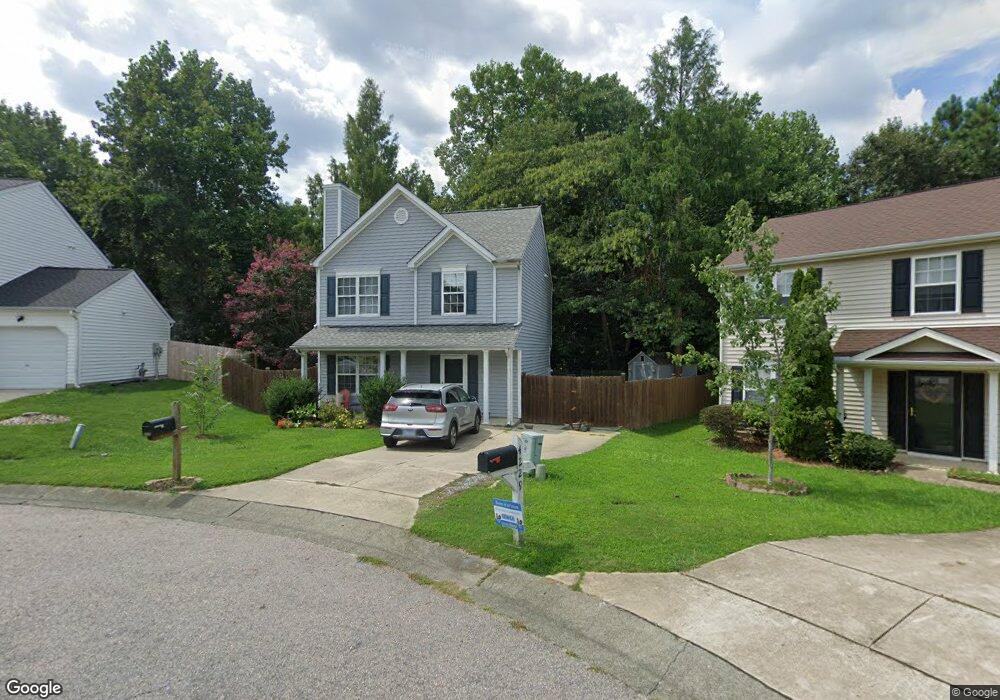
4225 Ivy Hill Rd Raleigh, NC 27616
Northeast Raleigh NeighborhoodEstimated Value: $295,000 - $318,132
3
Beds
3
Baths
1,326
Sq Ft
$233/Sq Ft
Est. Value
About This Home
This home is located at 4225 Ivy Hill Rd, Raleigh, NC 27616 and is currently estimated at $309,533, approximately $233 per square foot. 4225 Ivy Hill Rd is a home located in Wake County with nearby schools including River Bend Elementary, River Bend Middle, and Rolesville High School.
Ownership History
Date
Name
Owned For
Owner Type
Purchase Details
Closed on
Feb 21, 2017
Sold by
Taylor Dakota and Taylor Jason
Bought by
Vanvandeen Jeneessa Van
Current Estimated Value
Home Financials for this Owner
Home Financials are based on the most recent Mortgage that was taken out on this home.
Original Mortgage
$126,400
Outstanding Balance
$104,654
Interest Rate
4.2%
Mortgage Type
New Conventional
Estimated Equity
$204,879
Purchase Details
Closed on
Aug 30, 2013
Sold by
Stritzel Lawrence and Stritzel Amy B
Bought by
Gatehouse Dakota and Taylor Jason
Home Financials for this Owner
Home Financials are based on the most recent Mortgage that was taken out on this home.
Original Mortgage
$123,800
Interest Rate
4.39%
Mortgage Type
Purchase Money Mortgage
Purchase Details
Closed on
Feb 27, 2002
Sold by
D R Horton Inc Torrey
Bought by
Stritzel Lawrence N
Home Financials for this Owner
Home Financials are based on the most recent Mortgage that was taken out on this home.
Original Mortgage
$125,886
Interest Rate
6.81%
Mortgage Type
FHA
Create a Home Valuation Report for This Property
The Home Valuation Report is an in-depth analysis detailing your home's value as well as a comparison with similar homes in the area
Home Values in the Area
Average Home Value in this Area
Purchase History
| Date | Buyer | Sale Price | Title Company |
|---|---|---|---|
| Vanvandeen Jeneessa Van | $158,000 | None Available | |
| Gatehouse Dakota | $125,000 | None Available | |
| Stritzel Lawrence N | $128,000 | -- |
Source: Public Records
Mortgage History
| Date | Status | Borrower | Loan Amount |
|---|---|---|---|
| Open | Vanvandeen Jeneessa Van | $126,400 | |
| Previous Owner | Gatehouse Dakota | $123,800 | |
| Previous Owner | Stritzel Lawrence N | $125,886 |
Source: Public Records
Tax History Compared to Growth
Tax History
| Year | Tax Paid | Tax Assessment Tax Assessment Total Assessment is a certain percentage of the fair market value that is determined by local assessors to be the total taxable value of land and additions on the property. | Land | Improvement |
|---|---|---|---|---|
| 2025 | $2,640 | $300,454 | $100,000 | $200,454 |
| 2024 | $2,629 | $300,454 | $100,000 | $200,454 |
| 2023 | $1,932 | $175,378 | $44,000 | $131,378 |
| 2022 | $1,796 | $175,378 | $44,000 | $131,378 |
| 2021 | $1,726 | $175,378 | $44,000 | $131,378 |
| 2020 | $1,695 | $175,378 | $44,000 | $131,378 |
| 2019 | $1,564 | $133,267 | $32,000 | $101,267 |
| 2018 | $1,476 | $133,267 | $32,000 | $101,267 |
| 2017 | $1,406 | $133,267 | $32,000 | $101,267 |
| 2016 | $1,378 | $133,267 | $32,000 | $101,267 |
| 2015 | -- | $139,246 | $32,000 | $107,246 |
| 2014 | -- | $139,246 | $32,000 | $107,246 |
Source: Public Records
Map
Nearby Homes
- 4508 Centrebrook Cir
- 4208 Reddington Trail
- 4604 Treadstone Ct
- 4106 N New Hope Rd
- 4721 Mocha Ln
- 3825 Old Coach Rd
- 4200 James
- 4443 Antique Ln Unit D1
- 4317 Woodlawn Dr
- 3936 Iron Horse Rd
- 4500 Rivershyre Way
- 4416 Major Loring Way
- 4217 James Rd
- 3909 Iron Horse Rd
- 4109 St James Church Rd
- 4111 Saint James Church Rd
- 4425 Woodlawn Dr
- 4505 Woodlawn Dr
- 4809 Arbor Chase Dr
- 3622 Top of the Pines Ct
- 4229 Ivy Hill Rd
- 4305 Fawn Creek Ct
- 4309 Fawn Creek Ct
- 4233 Ivy Hill Rd
- 4217 Ivy Hill Rd
- 4228 Ivy Hill Rd
- 4213 Ivy Hill Rd
- 4308 Fawn Creek Ct
- 4304 Fawn Glen Dr
- 4300 Fawn Glen Dr
- 4224 Ivy Hill Rd
- 4220 Ivy Hill Rd
- 4216 Ivy Hill Rd
- 4209 Ivy Hill Rd
- 4304 Fawn Creek Ct
- 4309 Lost Forest Way
- 4313 Lost Forest Way
- 4212 Ivy Hill Rd
- 4208 Ivy Hill Rd
- 4205 Ivy Hill Rd