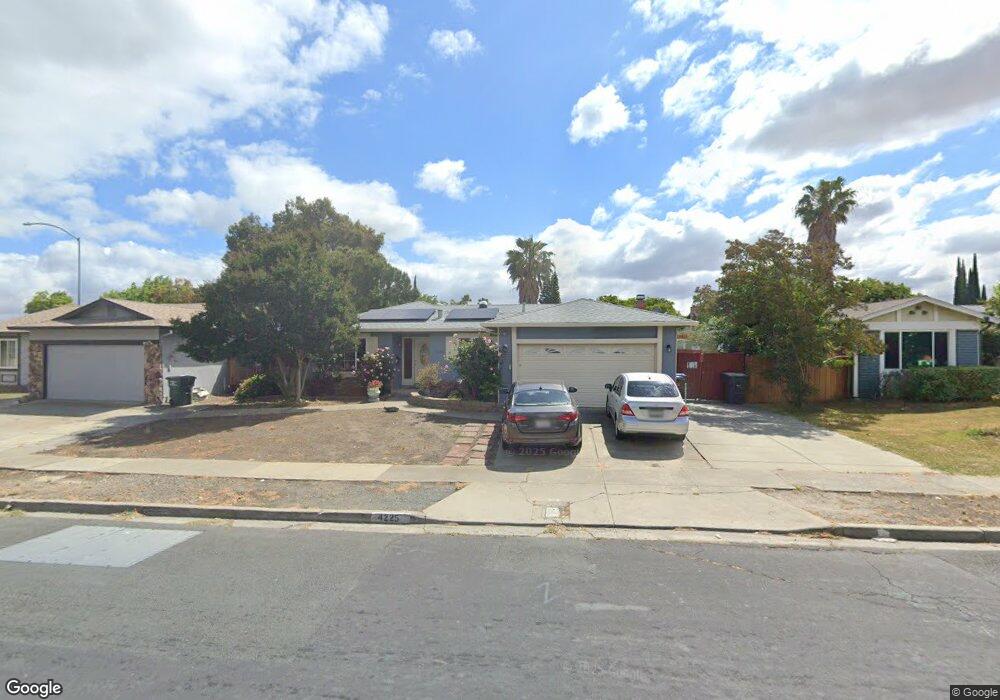
4225 Mcfaul Dr Pittsburg, CA 94565
East Contra Costa NeighborhoodEstimated Value: $554,101 - $709,000
4
Beds
2
Baths
1,497
Sq Ft
$403/Sq Ft
Est. Value
About This Home
This home is located at 4225 Mcfaul Dr, Pittsburg, CA 94565 and is currently estimated at $604,025, approximately $403 per square foot. 4225 Mcfaul Dr is a home located in Contra Costa County with nearby schools including Foothill Elementary School, Hillview Junior High School, and Pittsburg Senior High School.
Ownership History
Date
Name
Owned For
Owner Type
Purchase Details
Closed on
Dec 12, 2002
Sold by
Guillen Teresa M
Bought by
Guillen Teresa M
Current Estimated Value
Purchase Details
Closed on
Oct 13, 2000
Sold by
Harris Robert J
Bought by
Guillen Teresa M
Home Financials for this Owner
Home Financials are based on the most recent Mortgage that was taken out on this home.
Original Mortgage
$68,750
Interest Rate
7.89%
Mortgage Type
Stand Alone First
Purchase Details
Closed on
Jul 2, 1998
Sold by
Troia John A
Bought by
Harris Robert J
Home Financials for this Owner
Home Financials are based on the most recent Mortgage that was taken out on this home.
Original Mortgage
$98,000
Interest Rate
10.37%
Mortgage Type
Purchase Money Mortgage
Create a Home Valuation Report for This Property
The Home Valuation Report is an in-depth analysis detailing your home's value as well as a comparison with similar homes in the area
Home Values in the Area
Average Home Value in this Area
Purchase History
| Date | Buyer | Sale Price | Title Company |
|---|---|---|---|
| Guillen Teresa M | -- | -- | |
| Guillen Teresa M | $205,000 | Old Republic Title Company | |
| Harris Robert J | $140,000 | Placer Title Company |
Source: Public Records
Mortgage History
| Date | Status | Borrower | Loan Amount |
|---|---|---|---|
| Previous Owner | Guillen Teresa M | $68,750 | |
| Previous Owner | Harris Robert J | $98,000 | |
| Closed | Harris Robert J | $28,000 |
Source: Public Records
Tax History
| Year | Tax Paid | Tax Assessment Tax Assessment Total Assessment is a certain percentage of the fair market value that is determined by local assessors to be the total taxable value of land and additions on the property. | Land | Improvement |
|---|---|---|---|---|
| 2025 | $4,227 | $308,876 | $52,724 | $256,152 |
| 2024 | $4,061 | $302,821 | $51,691 | $251,130 |
| 2023 | $4,061 | $296,884 | $50,678 | $246,206 |
| 2022 | $4,118 | $291,064 | $49,685 | $241,379 |
| 2021 | $4,116 | $285,358 | $48,711 | $236,647 |
| 2019 | $3,922 | $276,896 | $47,267 | $229,629 |
| 2018 | $3,775 | $271,468 | $46,341 | $225,127 |
| 2017 | $3,750 | $266,146 | $45,433 | $220,713 |
| 2016 | $3,496 | $260,929 | $44,543 | $216,386 |
| 2015 | $3,643 | $257,010 | $43,874 | $213,136 |
| 2014 | $3,400 | $241,000 | $41,141 | $199,859 |
Source: Public Records
Map
Nearby Homes
- 1194 Ventura Dr
- 4221 Mcdermott Dr
- 4350 Palo Verde Dr
- 1248 Metten Ave
- 4175 Stephanie Way
- 4310 Foothill Way
- 38 Meadowbrook Ave
- 9 Palm Dr
- 4306 Goldenhill Dr
- 27 Barrie Dr
- 77 Hilo Dr
- 61 Pali Way
- 65 Pali Way
- 1871 Ventura Dr
- 141 Maui Dr
- 268 Coral Dr
- 134 Banyon Dr
- 109 Reef Dr Unit 109
- 210 Kona Cir
- 202 Queens Way
Your Personal Tour Guide
Ask me questions while you tour the home.