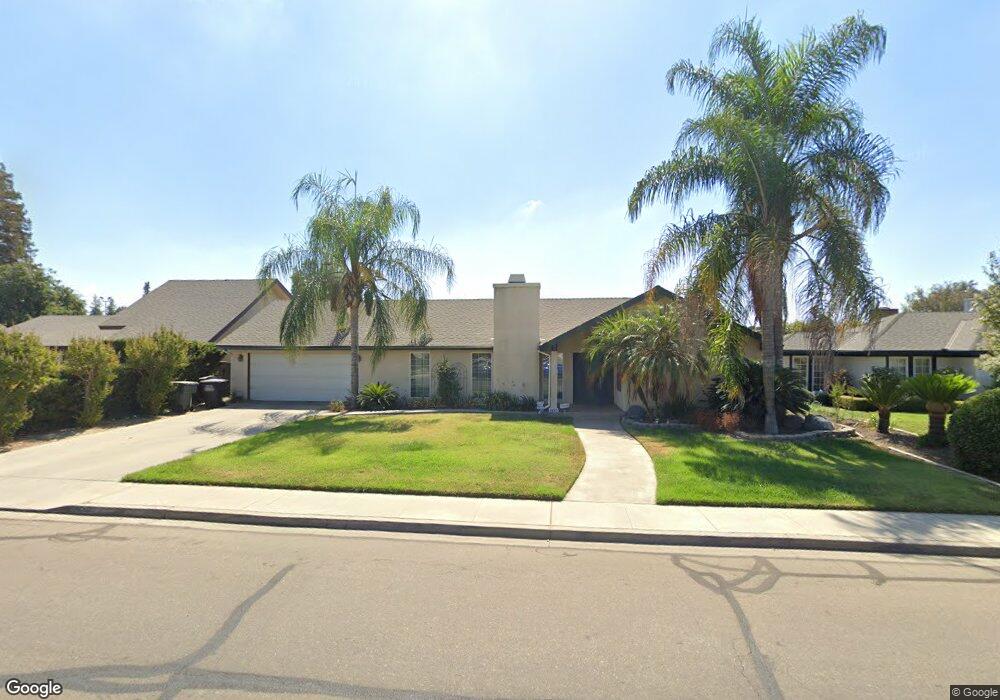
4225 W Nicholas Ave Visalia, CA 93291
Northwest Visalia NeighborhoodEstimated Value: $405,658 - $473,000
3
Beds
2
Baths
1,984
Sq Ft
$226/Sq Ft
Est. Value
About This Home
This home is located at 4225 W Nicholas Ave, Visalia, CA 93291 and is currently estimated at $448,665, approximately $226 per square foot. 4225 W Nicholas Ave is a home located in Tulare County with nearby schools including Willow Glen Elementary, Green Acres Middle School, and Redwood High School.
Ownership History
Date
Name
Owned For
Owner Type
Purchase Details
Closed on
Mar 13, 2001
Sold by
Sesock Anthony
Bought by
Dancil Ferdinand F and Dancil Dalila R
Current Estimated Value
Home Financials for this Owner
Home Financials are based on the most recent Mortgage that was taken out on this home.
Original Mortgage
$144,300
Outstanding Balance
$52,386
Interest Rate
6.98%
Mortgage Type
VA
Estimated Equity
$396,279
Purchase Details
Closed on
Sep 16, 1999
Sold by
Stock Kelly R
Bought by
Leprino Foods Company
Home Financials for this Owner
Home Financials are based on the most recent Mortgage that was taken out on this home.
Original Mortgage
$132,400
Interest Rate
7.76%
Purchase Details
Closed on
Sep 3, 1999
Sold by
Leprino Foods Company
Bought by
Sesock Anthony and Sesock Nicole L
Home Financials for this Owner
Home Financials are based on the most recent Mortgage that was taken out on this home.
Original Mortgage
$132,400
Interest Rate
7.76%
Purchase Details
Closed on
Apr 30, 1993
Sold by
Stock Kelly R
Bought by
Stock Kelly R
Create a Home Valuation Report for This Property
The Home Valuation Report is an in-depth analysis detailing your home's value as well as a comparison with similar homes in the area
Home Values in the Area
Average Home Value in this Area
Purchase History
| Date | Buyer | Sale Price | Title Company |
|---|---|---|---|
| Dancil Ferdinand F | $141,500 | Chicago Title Co | |
| Leprino Foods Company | -- | -- | |
| Sesock Anthony | $136,500 | Cuesta Title Company | |
| Stock Kelly R | -- | -- |
Source: Public Records
Mortgage History
| Date | Status | Borrower | Loan Amount |
|---|---|---|---|
| Open | Dancil Ferdinand F | $144,300 | |
| Previous Owner | Sesock Anthony | $132,400 |
Source: Public Records
Tax History
| Year | Tax Paid | Tax Assessment Tax Assessment Total Assessment is a certain percentage of the fair market value that is determined by local assessors to be the total taxable value of land and additions on the property. | Land | Improvement |
|---|---|---|---|---|
| 2025 | $2,210 | $216,571 | $67,808 | $148,763 |
| 2024 | $2,210 | $212,326 | $66,479 | $145,847 |
| 2023 | $2,148 | $208,164 | $65,176 | $142,988 |
| 2022 | $2,051 | $204,084 | $63,899 | $140,185 |
| 2021 | $2,052 | $200,082 | $62,646 | $137,436 |
| 2020 | $2,034 | $198,031 | $62,004 | $136,027 |
| 2019 | $1,975 | $194,148 | $60,788 | $133,360 |
| 2018 | $1,923 | $190,341 | $59,596 | $130,745 |
| 2017 | $1,902 | $186,608 | $58,427 | $128,181 |
| 2016 | $1,865 | $182,949 | $57,281 | $125,668 |
| 2015 | $1,809 | $180,201 | $56,421 | $123,780 |
| 2014 | $1,809 | $176,671 | $55,316 | $121,355 |
Source: Public Records
Map
Nearby Homes
- 907 N Bollinger St
- 1126 N Linwood St
- 3900 W Allen Ct
- 4340 W School Ave
- 745 N Fulgham Ct
- 3731 N Summers Ct
- 4708 W Hurley Ave
- 1242 N Julieann St
- 214 N Linwood St
- 725 N Silvervale Dr
- 4709 W School Ave
- 716 N Silvervale Dr
- 4132 W Robinwood Ave
- 1128 N Noyes Ct
- 1022 N Crenshaw Ct
- 4625 W Cecil Ave
- 3939 W Robinwood Ct
- 3939 W Robinwood Ave
- 3727 W Mill Creek Dr
- 4800 W Crowley Ct
- 4211 W Nicholas Ave
- 4235 W Nicholas Ave
- 4201 W Nicholas Ave
- 4247 W Nicholas Ave
- 4224 W Nicholas Ave
- 4236 W Nicholas Ave
- 4212 W Nicholas Ave
- 4202 W Nicholas Ave
- 4238 W Hurley Ave
- 4137 W Nicholas Ave
- 4309 W Nicholas Ave
- 834 N Rono St
- 4140 W Nicholas Ave
- 4227 W Grove Ct
- 4217 W Grove Ct
- 4314 W Nicholas Ave
- 4212 W Hurley Ave
- 4230 W Hurley Ave
- 4125 W Nicholas Ave
- 4321 W Nicholas Ave
Your Personal Tour Guide
Ask me questions while you tour the home.