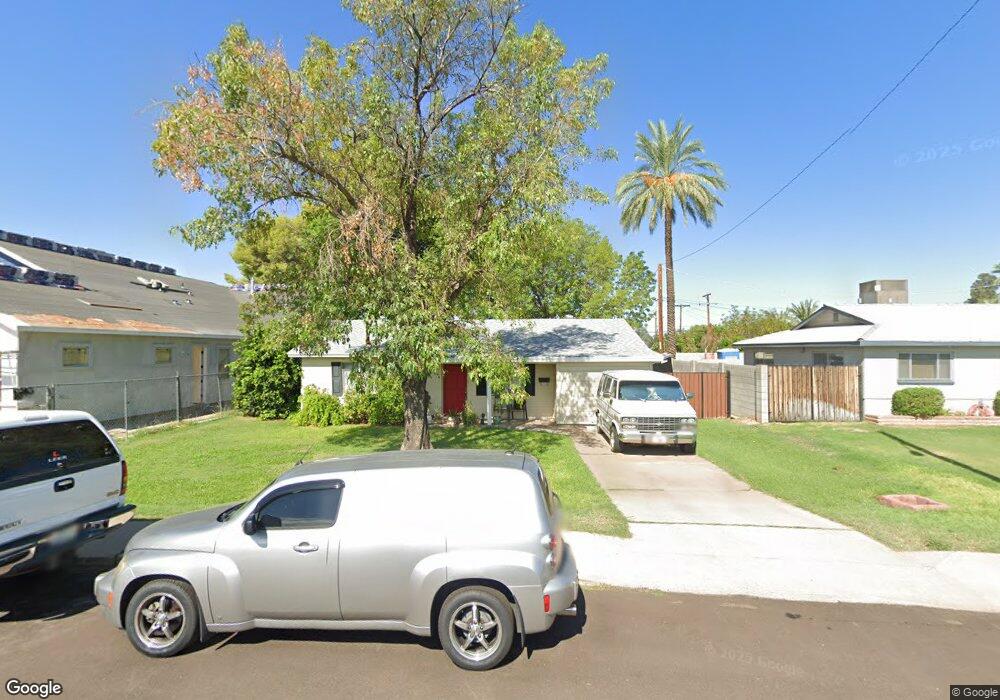
4226 N 41st Place Phoenix, AZ 85018
Camelback East Village NeighborhoodEstimated Value: $585,000 - $1,015,000
--
Bed
1
Bath
1,142
Sq Ft
$669/Sq Ft
Est. Value
About This Home
This home is located at 4226 N 41st Place, Phoenix, AZ 85018 and is currently estimated at $763,585, approximately $668 per square foot. 4226 N 41st Place is a home located in Maricopa County with nearby schools including Hopi Elementary School, Ingleside Middle School, and Ombudsman - Charter East.
Ownership History
Date
Name
Owned For
Owner Type
Purchase Details
Closed on
Mar 25, 2021
Sold by
Borg Timothy
Bought by
Burning Bush Trust and Borg
Current Estimated Value
Purchase Details
Closed on
Aug 12, 2020
Sold by
Burning Bush Properties Llc
Bought by
Borg Timothy
Purchase Details
Closed on
Apr 11, 2012
Sold by
Borg Ariel
Bought by
Burning Bush Properties Llc
Purchase Details
Closed on
Jan 11, 2010
Sold by
Foster Judy D
Bought by
Borg Ariel
Home Financials for this Owner
Home Financials are based on the most recent Mortgage that was taken out on this home.
Original Mortgage
$162,000
Interest Rate
4.78%
Mortgage Type
Purchase Money Mortgage
Create a Home Valuation Report for This Property
The Home Valuation Report is an in-depth analysis detailing your home's value as well as a comparison with similar homes in the area
Home Values in the Area
Average Home Value in this Area
Purchase History
| Date | Buyer | Sale Price | Title Company |
|---|---|---|---|
| Burning Bush Trust | -- | None Listed On Document | |
| Burning Bush Trust | -- | None Listed On Document | |
| Borg Timothy | -- | None Available | |
| Burning Bush Properties Llc | -- | None Available | |
| Borg Ariel | $180,000 | Equity Title Agency |
Source: Public Records
Mortgage History
| Date | Status | Borrower | Loan Amount |
|---|---|---|---|
| Previous Owner | Borg Ariel | $162,000 |
Source: Public Records
Tax History Compared to Growth
Tax History
| Year | Tax Paid | Tax Assessment Tax Assessment Total Assessment is a certain percentage of the fair market value that is determined by local assessors to be the total taxable value of land and additions on the property. | Land | Improvement |
|---|---|---|---|---|
| 2025 | $2,622 | $31,864 | -- | -- |
| 2024 | $2,454 | $30,346 | -- | -- |
| 2023 | $2,454 | $49,720 | $9,940 | $39,780 |
| 2022 | $2,354 | $39,580 | $7,910 | $31,670 |
| 2021 | $2,439 | $37,020 | $7,400 | $29,620 |
| 2020 | $2,403 | $35,330 | $7,060 | $28,270 |
| 2019 | $2,313 | $32,620 | $6,520 | $26,100 |
| 2018 | $2,225 | $29,650 | $5,930 | $23,720 |
| 2017 | $2,137 | $28,360 | $5,670 | $22,690 |
| 2016 | $2,082 | $24,480 | $4,890 | $19,590 |
| 2015 | $1,909 | $22,670 | $4,530 | $18,140 |
Source: Public Records
Map
Nearby Homes
- 4113 E Glenrosa Ave
- 4208 N 41st Place
- 4202 N 41st Place
- 4310 N 42nd Place
- 4119 E Monterosa St
- 3923 E Heatherbrae Dr
- 4316 N 40th St
- 4301 E Montecito Ave
- 4126 E Sells Dr
- 4308 E Montecito Ave
- 4145 E Campbell Ave
- 3838 E Devonshire Ave
- 3841 E Devonshire Ave
- 4240 E Sells Dr
- 4312 E Roma Ave
- 4242 N 44th St
- 4037 E Minnezona Ave
- 4311 E Sells Dr
- 3828 E Monterosa St Unit 15
- 3821 E Devonshire Ave
- 4222 N 41st Place
- 4222 N 41st Place Unit 6
- 4232 N 41st Place
- 4218 N 41st Place
- 4111 E Glenrosa Ave
- 4236 N 41st Place
- 4214 N 41st Place
- 4107 E Glenrosa Ave
- 4115 E Glenrosa Ave
- 4231 N 41st St
- 4041 E Glenrosa Ave
- 4227 N 41st Place
- 4125 E Glenrosa Ave
- 4223 N 41st Place
- 4223 N 41st Place Unit 5
- 4225 N 41st St
- 4231 N 41st Place
- 4219 N 41st Place
- 4033 E Glenrosa Ave
- 4237 N 41st Place