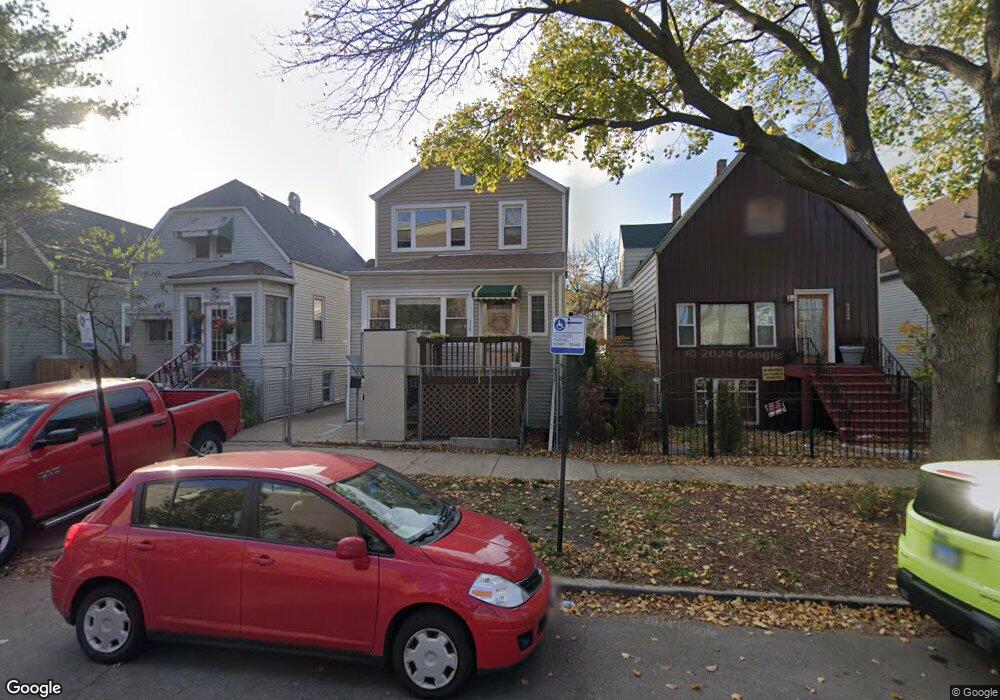
4226 S Talman Ave Chicago, IL 60632
Brighton Park NeighborhoodEstimated Value: $211,458 - $307,000
2
Beds
1
Bath
620
Sq Ft
$408/Sq Ft
Est. Value
About This Home
This home is located at 4226 S Talman Ave, Chicago, IL 60632 and is currently estimated at $253,115, approximately $408 per square foot. 4226 S Talman Ave is a home located in Cook County with nearby schools including Shields Elementary School, Shields Middle School, and Kelly High School.
Ownership History
Date
Name
Owned For
Owner Type
Purchase Details
Closed on
Mar 26, 2012
Sold by
Torres Daniel
Bought by
Torres Daniel and Torres Silvia
Current Estimated Value
Home Financials for this Owner
Home Financials are based on the most recent Mortgage that was taken out on this home.
Original Mortgage
$45,000
Interest Rate
3.92%
Mortgage Type
New Conventional
Purchase Details
Closed on
Feb 27, 1999
Sold by
St Anthony Bank
Bought by
Torres Daniel
Home Financials for this Owner
Home Financials are based on the most recent Mortgage that was taken out on this home.
Original Mortgage
$90,250
Outstanding Balance
$22,197
Interest Rate
6.94%
Estimated Equity
$230,918
Purchase Details
Closed on
Mar 24, 1994
Sold by
Basich Dan
Bought by
Basich Dan and Basich Letitia Stroth
Home Financials for this Owner
Home Financials are based on the most recent Mortgage that was taken out on this home.
Original Mortgage
$92,000
Interest Rate
7.5%
Create a Home Valuation Report for This Property
The Home Valuation Report is an in-depth analysis detailing your home's value as well as a comparison with similar homes in the area
Home Values in the Area
Average Home Value in this Area
Purchase History
| Date | Buyer | Sale Price | Title Company |
|---|---|---|---|
| Torres Daniel | -- | Git | |
| Torres Daniel | $95,000 | -- | |
| Basich Dan | -- | -- |
Source: Public Records
Mortgage History
| Date | Status | Borrower | Loan Amount |
|---|---|---|---|
| Closed | Torres Daniel | $45,000 | |
| Open | Torres Daniel | $90,250 | |
| Previous Owner | Basich Dan | $92,000 |
Source: Public Records
Tax History Compared to Growth
Tax History
| Year | Tax Paid | Tax Assessment Tax Assessment Total Assessment is a certain percentage of the fair market value that is determined by local assessors to be the total taxable value of land and additions on the property. | Land | Improvement |
|---|---|---|---|---|
| 2024 | $1,490 | $21,000 | $4,725 | $16,275 |
| 2023 | $1,426 | $11,000 | $3,780 | $7,220 |
| 2022 | $1,426 | $11,000 | $3,780 | $7,220 |
| 2021 | $1,408 | $11,000 | $3,780 | $7,220 |
| 2020 | $1,503 | $10,428 | $3,780 | $6,648 |
| 2019 | $1,564 | $11,850 | $3,780 | $8,070 |
| 2018 | $1,536 | $11,850 | $3,780 | $8,070 |
| 2017 | $1,115 | $9,195 | $3,402 | $5,793 |
| 2016 | $1,206 | $9,195 | $3,402 | $5,793 |
| 2015 | $1,075 | $9,195 | $3,402 | $5,793 |
| 2014 | $1,041 | $8,868 | $3,213 | $5,655 |
| 2013 | $1,006 | $8,868 | $3,213 | $5,655 |
Source: Public Records
Map
Nearby Homes
- 2719 W Pope John Paul ii Dr
- 4149 S Rockwell St
- 4331 S California Ave
- 4039 S Montgomery Ave
- 4415 S Rockwell St
- 4034 S Maplewood Ave
- 4024 S Rockwell St
- 4132 S Mozart St
- 4417 S Campbell Ave
- 4757 S Maplewood Ave
- 4756 S Maplewood Ave
- 4759 S Maplewood Ave
- 4334 S Western Ave
- 3951 S Campbell Ave
- 4759 S Rockwell St
- 4754 S Rockwell St
- 4756 S Rockwell St
- 2728 W 39th Place
- 4555 S Washtenaw Ave
- 4002 S Western Ave Unit 2
- 4224 S Talman Ave
- 4230 S Talman Ave
- 4220 S Talman Ave
- 4232 S Talman Ave
- 4218 S Talman Ave
- 4236 S Talman Ave
- 4216 S Talman Ave
- 4216 S Talman Ave
- 4238 S Talman Ave Unit 1
- 4238 S Talman Ave
- 4225 S Washtenaw Ave
- 4223 S Washtenaw Ave
- 4212 S Talman Ave Unit 2
- 4233 S Washtenaw Ave
- 4221 S Washtenaw Ave
- 4242 S Talman Ave
- 4242 S Talman Ave Unit 1
- 4208 S Talman Ave
- 4229 S Washtenaw Ave
- 4229 S Washtenaw Ave