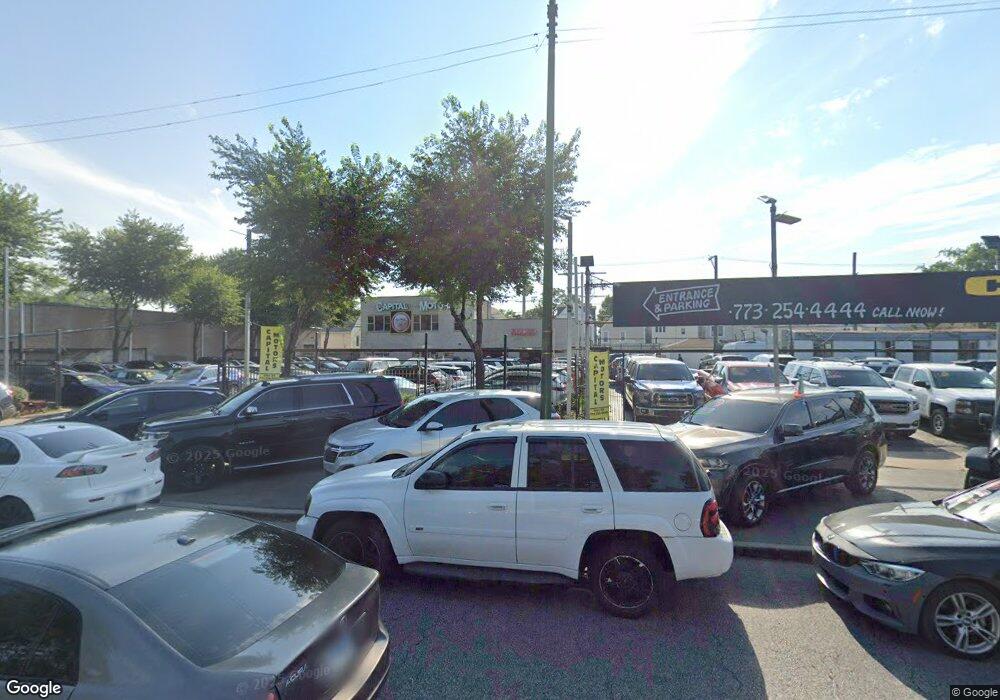
4226 S Western Ave Chicago, IL 60609
Brighton Park Neighborhood
9
Beds
2
Baths
2,627
Sq Ft
0.7
Acres
About This Home
This home is located at 4226 S Western Ave, Chicago, IL 60609. 4226 S Western Ave is a home located in Cook County with nearby schools including Shields Elementary School, Shields Middle School, and Kelly High School.
Ownership History
Date
Name
Owned For
Owner Type
Purchase Details
Closed on
Aug 1, 2016
Sold by
Almemer Nabil
Bought by
Alnemer Properties Llc
Purchase Details
Closed on
Oct 4, 2010
Sold by
Chicago Title Land Trust Company
Bought by
Alnemer Nabil
Purchase Details
Closed on
Jan 24, 2007
Sold by
Beltran Jose
Bought by
Chicago Title Land Trust Co and Trust #8002348066
Purchase Details
Closed on
Aug 28, 2006
Sold by
Garcia Dario
Bought by
Beltran Jose
Purchase Details
Closed on
Mar 28, 2006
Sold by
Beltran Jose
Bought by
Garcia Dario
Home Financials for this Owner
Home Financials are based on the most recent Mortgage that was taken out on this home.
Original Mortgage
$323,000
Interest Rate
9.12%
Mortgage Type
Commercial
Purchase Details
Closed on
Feb 2, 2000
Sold by
Ramirez Jose E and Ramirez Blanca
Bought by
Beltran Jose
Home Financials for this Owner
Home Financials are based on the most recent Mortgage that was taken out on this home.
Original Mortgage
$152,741
Interest Rate
7.98%
Mortgage Type
FHA
Create a Home Valuation Report for This Property
The Home Valuation Report is an in-depth analysis detailing your home's value as well as a comparison with similar homes in the area
Home Values in the Area
Average Home Value in this Area
Purchase History
| Date | Buyer | Sale Price | Title Company |
|---|---|---|---|
| Alnemer Properties Llc | -- | Attorney | |
| Alnemer Nabil | $210,000 | Chicago Title Land Trust Co | |
| Chicago Title Land Trust Co | $375,000 | None Available | |
| Beltran Jose | -- | None Available | |
| Garcia Dario | -- | Law Title Insurance | |
| Beltran Jose | $154,000 | Chicago Title Insurance Co |
Source: Public Records
Mortgage History
| Date | Status | Borrower | Loan Amount |
|---|---|---|---|
| Previous Owner | Garcia Dario | $323,000 | |
| Previous Owner | Beltran Jose | $152,741 |
Source: Public Records
Tax History Compared to Growth
Tax History
| Year | Tax Paid | Tax Assessment Tax Assessment Total Assessment is a certain percentage of the fair market value that is determined by local assessors to be the total taxable value of land and additions on the property. | Land | Improvement |
|---|---|---|---|---|
| 2024 | $2,946 | $16,595 | $11,430 | $5,165 |
| 2023 | $2,873 | $13,888 | $10,859 | $3,029 |
| 2022 | $2,873 | $13,888 | $10,859 | $3,029 |
| 2021 | $2,793 | $13,887 | $10,858 | $3,029 |
| 2020 | $4,532 | $20,214 | $10,858 | $9,356 |
| 2019 | $4,087 | $20,214 | $10,858 | $9,356 |
| 2018 | $4,019 | $20,214 | $10,858 | $9,356 |
| 2017 | $4,177 | $19,278 | $9,906 | $9,372 |
| 2016 | $3,887 | $19,278 | $9,906 | $9,372 |
| 2015 | $3,947 | $21,385 | $9,906 | $11,479 |
| 2014 | $3,999 | $21,385 | $9,906 | $11,479 |
| 2013 | $2,678 | $14,605 | $9,906 | $4,699 |
Source: Public Records
Map
Nearby Homes
- 4334 S Western Ave
- 4149 S Rockwell St
- 4417 S Campbell Ave
- 4002 S Western Ave Unit 2
- 4034 S Maplewood Ave
- 4415 S Rockwell St
- 3951 S Campbell Ave
- 4024 S Rockwell St
- 4759 S Maplewood Ave
- 4757 S Maplewood Ave
- 4756 S Maplewood Ave
- 2719 W Pope John Paul ii Dr
- 4039 S Montgomery Ave
- 2323 W Pershing Rd Unit 230
- 2323 W Pershing Rd Unit 104
- 2323 W Pershing Rd Unit 140
- 2323 W Pershing Rd Unit 124
- 2323 W Pershing Rd Unit 611
- 2323 W Pershing Rd Unit 421
- 2434 W Pershing Rd
- 4226 S Western Ave
- 4228 S Western Ave
- 4221 S Artesian Ave
- 4235 S Artesian Ave
- 4225 S Artesian Ave
- 4227 S Artesian Ave
- 4227 S Artesian Ave
- 4231 S Artesian Ave
- 4223 S Artesian Ave Unit 1
- 4239 S Artesian Ave
- 4237 S Artesian Ave
- 4217 S Artesian Ave Unit 2
- 4217 S Artesian Ave
- 4215 S Artesian Ave Unit 2
- 4243 S Artesian Ave
- 4209 S Artesian Ave
- 4213 S Artesian Ave
- 4247 S Artesian Ave
- 4247 S Artesian Ave
- 4207 S Artesian Ave