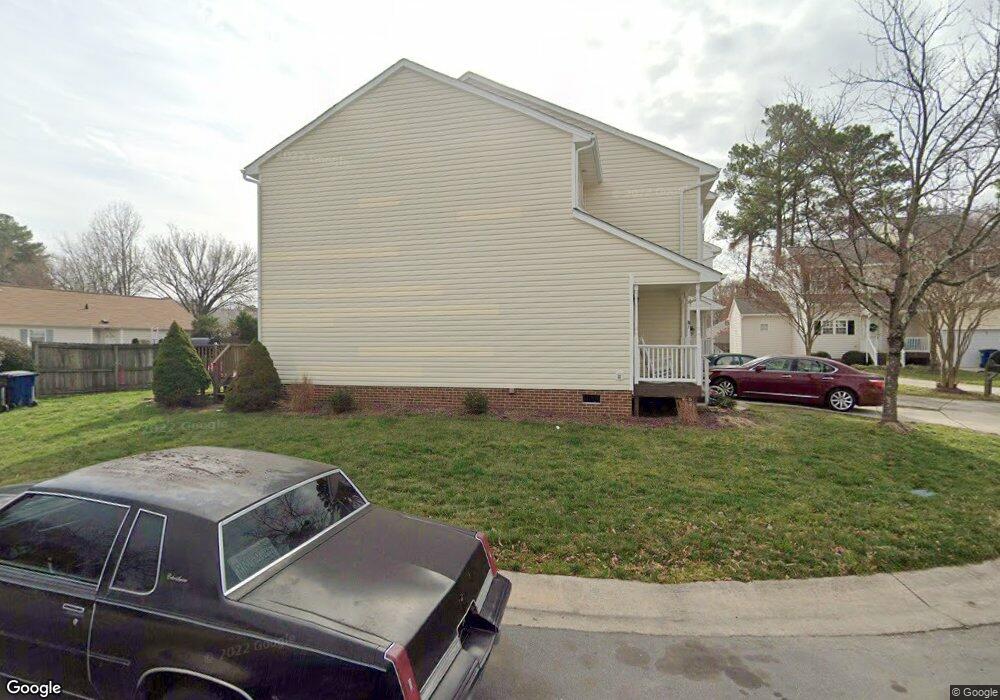
4226 Standing Rock Way Raleigh, NC 27604
Northeast Raleigh NeighborhoodEstimated Value: $257,457 - $277,000
3
Beds
3
Baths
1,470
Sq Ft
$183/Sq Ft
Est. Value
About This Home
This home is located at 4226 Standing Rock Way, Raleigh, NC 27604 and is currently estimated at $268,864, approximately $182 per square foot. 4226 Standing Rock Way is a home located in Wake County with nearby schools including Wilburn Elementary, Durant Road Middle, and Millbrook High School.
Ownership History
Date
Name
Owned For
Owner Type
Purchase Details
Closed on
May 17, 2019
Sold by
Jones Mary K and Jones Kendall
Bought by
Ward Susan M
Current Estimated Value
Purchase Details
Closed on
Nov 22, 2017
Sold by
Richards Laura J and Johnson Sigvard B
Bought by
J0nes Mary Kathryn
Home Financials for this Owner
Home Financials are based on the most recent Mortgage that was taken out on this home.
Original Mortgage
$108,800
Interest Rate
3.88%
Mortgage Type
New Conventional
Purchase Details
Closed on
Dec 19, 2005
Sold by
Ward Robert B
Bought by
Johnson Sigvard B
Home Financials for this Owner
Home Financials are based on the most recent Mortgage that was taken out on this home.
Original Mortgage
$120,000
Interest Rate
9.3%
Mortgage Type
Fannie Mae Freddie Mac
Purchase Details
Closed on
Apr 14, 1999
Sold by
Jones Walter M and Jones Patricia Ladreth
Bought by
Ward Robert B and Ward Phyllis J
Home Financials for this Owner
Home Financials are based on the most recent Mortgage that was taken out on this home.
Original Mortgage
$126,735
Interest Rate
7.08%
Mortgage Type
FHA
Create a Home Valuation Report for This Property
The Home Valuation Report is an in-depth analysis detailing your home's value as well as a comparison with similar homes in the area
Home Values in the Area
Average Home Value in this Area
Purchase History
| Date | Buyer | Sale Price | Title Company |
|---|---|---|---|
| Ward Susan M | $167,500 | None Available | |
| J0nes Mary Kathryn | $136,000 | None Available | |
| Johnson Sigvard B | $117,500 | None Available | |
| Ward Robert B | $127,000 | -- |
Source: Public Records
Mortgage History
| Date | Status | Borrower | Loan Amount |
|---|---|---|---|
| Previous Owner | J0nes Mary Kathryn | $108,800 | |
| Previous Owner | Johnson Sigvard B | $120,000 | |
| Previous Owner | Ward Robert B | $126,735 |
Source: Public Records
Tax History Compared to Growth
Tax History
| Year | Tax Paid | Tax Assessment Tax Assessment Total Assessment is a certain percentage of the fair market value that is determined by local assessors to be the total taxable value of land and additions on the property. | Land | Improvement |
|---|---|---|---|---|
| 2025 | $2,172 | $246,789 | $50,000 | $196,789 |
| 2024 | $2,163 | $246,789 | $50,000 | $196,789 |
| 2023 | $1,804 | $163,702 | $26,000 | $137,702 |
| 2022 | $1,677 | $163,702 | $26,000 | $137,702 |
| 2021 | $1,613 | $163,702 | $26,000 | $137,702 |
| 2020 | $1,584 | $163,702 | $26,000 | $137,702 |
| 2019 | $1,343 | $114,160 | $20,000 | $94,160 |
| 2018 | $1,267 | $114,160 | $20,000 | $94,160 |
| 2017 | $1,208 | $114,160 | $20,000 | $94,160 |
| 2016 | $1,183 | $114,160 | $20,000 | $94,160 |
| 2015 | $1,396 | $132,929 | $22,000 | $110,929 |
| 2014 | $1,325 | $132,929 | $22,000 | $110,929 |
Source: Public Records
Map
Nearby Homes
- 4120 Standing Rock Way
- 4221 Tensity Dr
- 4236 Tensity Dr
- 4204 Belington Ct
- 2400 Dorety Place
- 4544 Dilford Dr
- 2424 Dorety Place
- 4412 Birmingham Way
- Wyatt Plan at Elm Grove - Club Collection
- 2300 Oakwood Meadows Ct
- 4608 Mowbray Dr
- 2307 Oakwood Meadows Ct
- 2305 Oakwood Meadows Ct
- 2303 Oakwood Meadows Ct
- Jackson Plan at Elm Grove - City Collection
- 2848 Roundleaf Ct
- 2301 Oakwood Meadows Ct
- 2311 Oakwood Meadows Ct
- 2309 Oakwood Meadows Ct
- 4225 Lake Woodard Dr
- 4224 Standing Rock Way
- 4222 Standing Rock Way
- 4220 Standing Rock Way
- 4206 Standing Rock Way
- 4204 Standing Rock Way
- 4300 Standing Rock Way
- 4225 Standing Rock Way
- 4202 Standing Rock Way
- 4227 Standing Rock Way
- 4201 Standing Rock Way
- 4203 Standing Rock Way
- 2290 Charny Dr
- 4200 Standing Rock Way
- 4221 Standing Rock Way
- 4205 Standing Rock Way
- 4299 Mantua Way
- 4247 Toccopola St
- 4304 Standing Rock Way
- 4207 Standing Rock Way
- 4219 Mantua Way