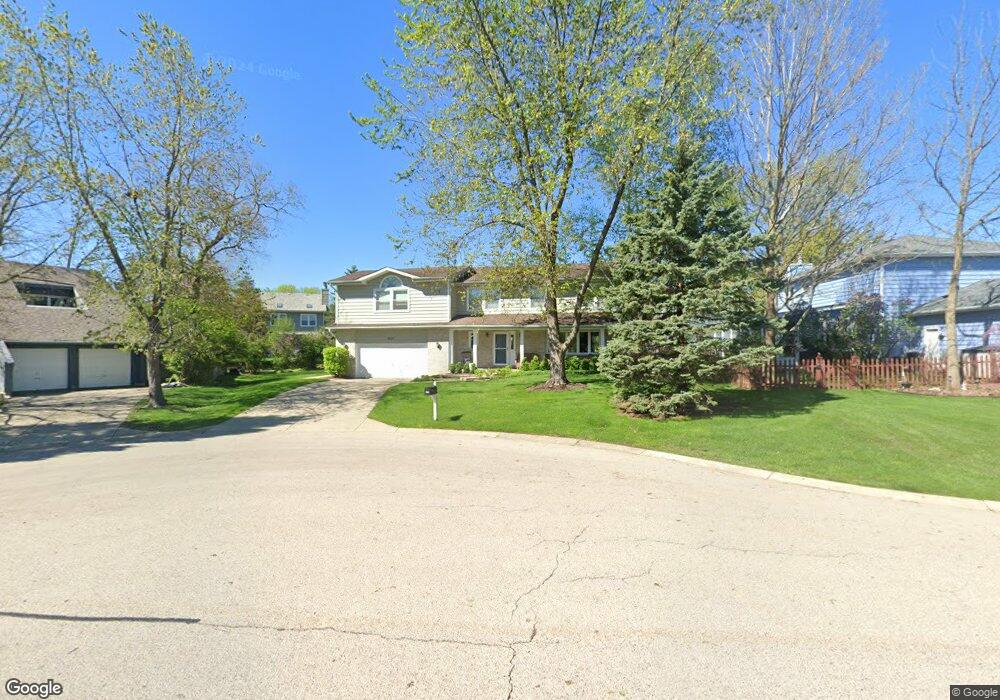
4227 Cobblestone Ct Gurnee, IL 60031
Estimated Value: $434,244 - $559,000
Studio
3
Baths
2,897
Sq Ft
$173/Sq Ft
Est. Value
About This Home
This home is located at 4227 Cobblestone Ct, Gurnee, IL 60031 and is currently estimated at $501,561, approximately $173 per square foot. 4227 Cobblestone Ct is a home located in Lake County with nearby schools including Woodland Primary School, Woodland Intermediate School, and Woodland Elementary School.
Ownership History
Date
Name
Owned For
Owner Type
Purchase Details
Closed on
Jul 29, 2005
Sold by
Rode Christopher J and Heinrich Rode Jorry
Bought by
Paukert Thomas D and Paukert Linda
Current Estimated Value
Home Financials for this Owner
Home Financials are based on the most recent Mortgage that was taken out on this home.
Original Mortgage
$280,000
Outstanding Balance
$146,553
Interest Rate
5.8%
Mortgage Type
Fannie Mae Freddie Mac
Estimated Equity
$355,008
Purchase Details
Closed on
Nov 30, 1998
Sold by
Hoos Ingrid M and Ingrid M Hoos Living Trust
Bought by
Rode Christopher J and Heinrich Jorry L
Home Financials for this Owner
Home Financials are based on the most recent Mortgage that was taken out on this home.
Original Mortgage
$216,600
Interest Rate
7.02%
Purchase Details
Closed on
Mar 11, 1997
Sold by
Hoos Ingrid M
Bought by
Hoos Ingrid M and Ingrid M Hoos Living Trust
Create a Home Valuation Report for This Property
The Home Valuation Report is an in-depth analysis detailing your home's value as well as a comparison with similar homes in the area
Home Values in the Area
Average Home Value in this Area
Purchase History
| Date | Buyer | Sale Price | Title Company |
|---|---|---|---|
| Paukert Thomas D | $350,000 | Chicago Title Insurance Comp | |
| Rode Christopher J | $228,000 | -- | |
| Hoos Ingrid M | -- | -- |
Source: Public Records
Mortgage History
| Date | Status | Borrower | Loan Amount |
|---|---|---|---|
| Open | Paukert Thomas D | $280,000 | |
| Previous Owner | Rode Christopher J | $216,600 |
Source: Public Records
Tax History
| Year | Tax Paid | Tax Assessment Tax Assessment Total Assessment is a certain percentage of the fair market value that is determined by local assessors to be the total taxable value of land and additions on the property. | Land | Improvement |
|---|---|---|---|---|
| 2024 | $10,633 | $137,088 | $19,651 | $117,437 |
| 2023 | $10,989 | $114,476 | $16,409 | $98,067 |
| 2022 | $10,989 | $116,919 | $16,405 | $100,514 |
| 2021 | $9,941 | $112,228 | $15,747 | $96,481 |
| 2020 | $9,620 | $109,469 | $15,360 | $94,109 |
| 2019 | $9,343 | $106,291 | $14,914 | $91,377 |
| 2018 | $10,523 | $120,397 | $14,657 | $105,740 |
| 2017 | $10,411 | $116,947 | $14,237 | $102,710 |
| 2016 | $10,330 | $111,740 | $13,603 | $98,137 |
| 2015 | $10,069 | $105,975 | $12,901 | $93,074 |
| 2014 | $9,683 | $102,828 | $13,513 | $89,315 |
| 2012 | $9,175 | $103,615 | $13,616 | $89,999 |
Source: Public Records
Map
Nearby Homes
- 468 Tanglewood Dr
- 450 Tanglewood Dr
- 546 Thorndale Ave
- 4185 Eastwood Place
- 33718 N Oplaine Rd
- 4437-4495 W Kennedy Dr
- 4520 W Lawn Ave
- 3861 Sutherland Dr
- 4390 W Parkway Ave
- 4447 W Lawn Ave
- 968 S Darla Ct
- 3810 1st St
- 387 Long Hill Rd
- 4481 W Tucker Ln
- 134 Heritage Ct Unit B
- 287 Kensington Ct Unit 4
- 1102 S Oplaine Rd
- 4232 Kenwood Ave
- 1251 S Pleasant Hill Gate Unit 21
- 601 Lakehurst Rd
- 4239 Cobblestone Ct
- 4219 Cobblestone Ct
- 4292 Crabtree Ct
- 489 Tanglewood Dr Unit 3
- 4304 Crabtree Ct
- 4288 Crabtree Ct
- 4210 Cobblestone Ct
- 501 Tanglewood Dr
- 4234 Cobblestone Ct
- 4226 Cobblestone Ct
- 4316 Crabtree Ct
- 4218 Cobblestone Ct
- 512 Tanglewood Dr
- 500 Tanglewood Dr
- 513 Tanglewood Dr
- 524 Tanglewood Dr
- 4285 Crabtree Ct
- 492 Tanglewood Dr
- 4328 Crabtree Ct
- 582 Kim Ct Unit VI
Your Personal Tour Guide
Ask me questions while you tour the home.