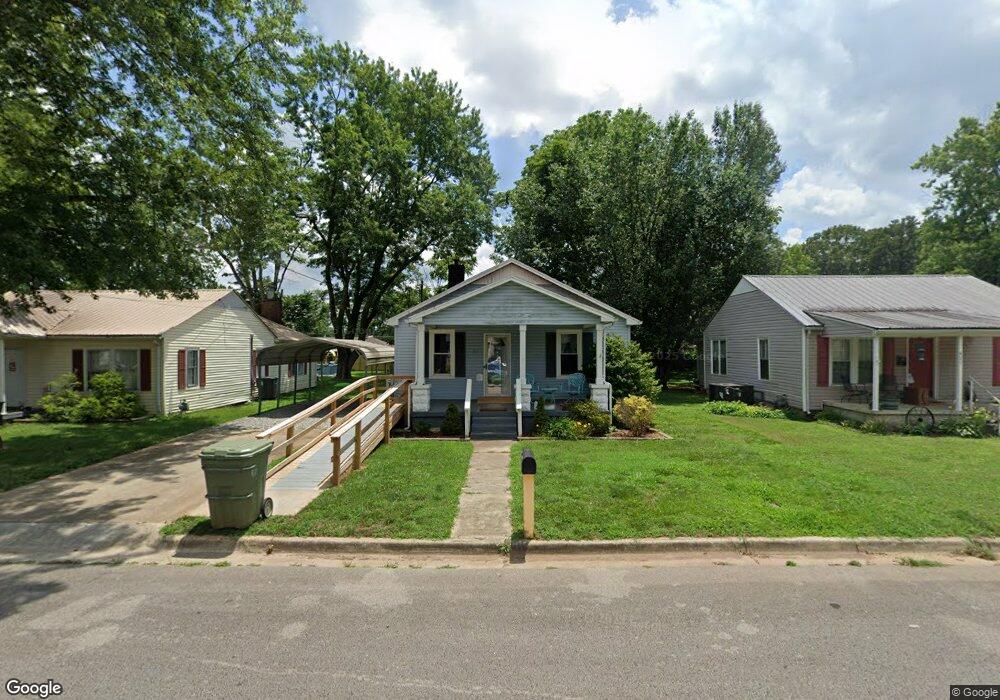
423 1st St Lawrenceburg, TN 38464
Estimated Value: $71,783 - $135,000
--
Bed
1
Bath
676
Sq Ft
$153/Sq Ft
Est. Value
About This Home
This home is located at 423 1st St, Lawrenceburg, TN 38464 and is currently estimated at $103,196, approximately $152 per square foot. 423 1st St is a home located in Lawrence County with nearby schools including Ingram Sowell Elementary School, Lawrenceburg Public Elementary School, and David Crockett Elementary School.
Ownership History
Date
Name
Owned For
Owner Type
Purchase Details
Closed on
Jan 11, 2023
Sold by
Kilburn Steve
Bought by
Rogers William Blake and Rogers Haylee
Current Estimated Value
Purchase Details
Closed on
Jul 16, 2020
Sold by
Byrd Joshua Matthew and Berryhill Noah Brock
Bought by
Kilburn Steve
Purchase Details
Closed on
Aug 22, 2016
Sold by
Byrd Joshua Matthew
Bought by
Byrd Joshua Matthew and Berryhill Noah Brock
Purchase Details
Closed on
Mar 28, 2013
Sold by
Byrd Brandy King
Bought by
Byrd Joshua Matthew
Purchase Details
Closed on
Mar 19, 2008
Sold by
Byrd Larry J
Bought by
Matthew Byrd Joshua
Home Financials for this Owner
Home Financials are based on the most recent Mortgage that was taken out on this home.
Original Mortgage
$22,100
Interest Rate
5.97%
Purchase Details
Closed on
Jan 21, 2000
Sold by
Richter Edna T and Richter B T
Bought by
Byrd Larry J
Purchase Details
Closed on
Apr 8, 1964
Create a Home Valuation Report for This Property
The Home Valuation Report is an in-depth analysis detailing your home's value as well as a comparison with similar homes in the area
Home Values in the Area
Average Home Value in this Area
Purchase History
| Date | Buyer | Sale Price | Title Company |
|---|---|---|---|
| Rogers William Blake | $96,809 | -- | |
| Kilburn Steve | $50,000 | None Available | |
| Byrd Joshua Matthew | -- | -- | |
| Byrd Joshua Matthew | -- | -- | |
| Matthew Byrd Joshua | $22,100 | -- | |
| Byrd Larry J | $32,000 | -- | |
| -- | -- | -- |
Source: Public Records
Mortgage History
| Date | Status | Borrower | Loan Amount |
|---|---|---|---|
| Previous Owner | Not Available | $22,100 |
Source: Public Records
Tax History Compared to Growth
Tax History
| Year | Tax Paid | Tax Assessment Tax Assessment Total Assessment is a certain percentage of the fair market value that is determined by local assessors to be the total taxable value of land and additions on the property. | Land | Improvement |
|---|---|---|---|---|
| 2025 | $399 | $12,850 | $0 | $0 |
| 2024 | $400 | $12,850 | $1,500 | $11,350 |
| 2023 | $400 | $18,525 | $1,500 | $17,025 |
| 2022 | $400 | $12,875 | $1,500 | $11,375 |
| 2021 | $382 | $8,675 | $1,500 | $7,175 |
| 2020 | $290 | $8,675 | $1,500 | $7,175 |
| 2019 | $290 | $6,600 | $1,500 | $5,100 |
| 2018 | $290 | $6,600 | $1,500 | $5,100 |
| 2017 | $290 | $6,600 | $1,500 | $5,100 |
| 2016 | $290 | $6,600 | $1,500 | $5,100 |
| 2015 | $275 | $6,600 | $1,500 | $5,100 |
| 2014 | $263 | $6,325 | $1,500 | $4,825 |
Source: Public Records
Map
Nearby Homes