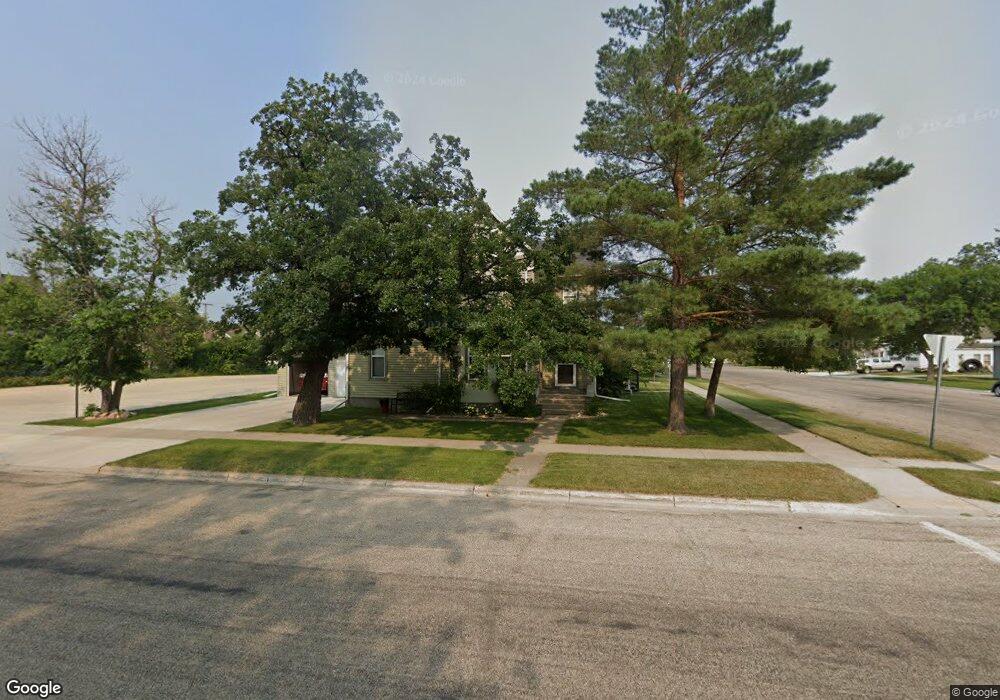
423 3rd Ave SE Jamestown, ND 58401
Estimated Value: $169,000 - $217,247
4
Beds
2
Baths
2,648
Sq Ft
$72/Sq Ft
Est. Value
About This Home
This home is located at 423 3rd Ave SE, Jamestown, ND 58401 and is currently estimated at $191,812, approximately $72 per square foot. 423 3rd Ave SE is a home located in Stutsman County with nearby schools including Jamestown High School, St. John's Academy, and Our Saviors Lutheran E.
Ownership History
Date
Name
Owned For
Owner Type
Purchase Details
Closed on
Oct 7, 2013
Sold by
Cozby John P and Cozby Shannon V
Bought by
Moser Kelan D and Moser Jessica L
Current Estimated Value
Home Financials for this Owner
Home Financials are based on the most recent Mortgage that was taken out on this home.
Original Mortgage
$142,500
Outstanding Balance
$106,687
Interest Rate
4.56%
Mortgage Type
New Conventional
Estimated Equity
$85,125
Purchase Details
Closed on
Apr 28, 2006
Sold by
Hull Jane A and Hull Logan W
Bought by
Cozby Ii John P and Cozby Ii Shannon
Home Financials for this Owner
Home Financials are based on the most recent Mortgage that was taken out on this home.
Original Mortgage
$49,900
Interest Rate
6.37%
Mortgage Type
New Conventional
Create a Home Valuation Report for This Property
The Home Valuation Report is an in-depth analysis detailing your home's value as well as a comparison with similar homes in the area
Home Values in the Area
Average Home Value in this Area
Purchase History
| Date | Buyer | Sale Price | Title Company |
|---|---|---|---|
| Moser Kelan D | $150,000 | None Available | |
| Cozby Ii John P | $49,900 | None Available |
Source: Public Records
Mortgage History
| Date | Status | Borrower | Loan Amount |
|---|---|---|---|
| Open | Moser Kelan D | $142,500 | |
| Previous Owner | Cozby Ii John P | $49,900 |
Source: Public Records
Tax History Compared to Growth
Tax History
| Year | Tax Paid | Tax Assessment Tax Assessment Total Assessment is a certain percentage of the fair market value that is determined by local assessors to be the total taxable value of land and additions on the property. | Land | Improvement |
|---|---|---|---|---|
| 2025 | $1,962 | $119,400 | $5,050 | $114,350 |
| 2024 | $1,962 | $73,468 | $5,899 | $67,569 |
| 2023 | $2,546 | $70,649 | $5,672 | $64,977 |
| 2022 | $2,363 | $65,416 | $5,252 | $60,164 |
| 2021 | $2,281 | $61,900 | $5,050 | $56,850 |
| 2020 | $2,225 | $60,700 | $5,050 | $55,650 |
| 2019 | $2,237 | $59,950 | $5,050 | $54,900 |
| 2018 | $2,281 | $57,450 | $0 | $0 |
| 2017 | $2,098 | $56,900 | $0 | $0 |
| 2016 | $1,466 | $56,700 | $0 | $0 |
| 2013 | -- | $2,745 | $311 | $2,435 |
Source: Public Records
Map
Nearby Homes