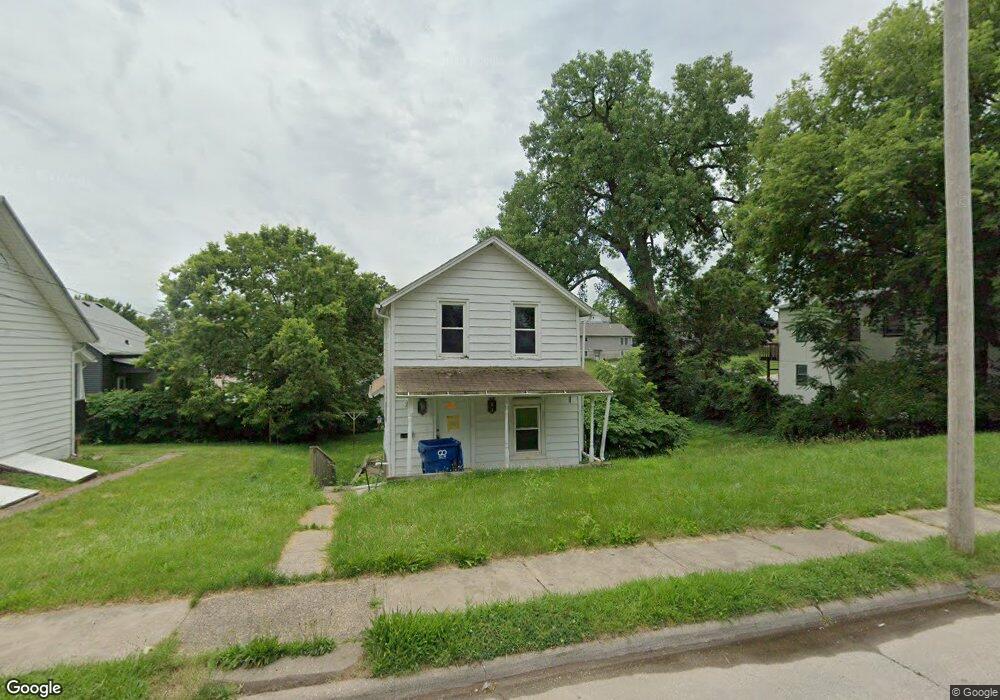
423 E 9th St Davenport, IA 52803
Central Davenport NeighborhoodEstimated Value: $81,000 - $114,925
1
Bed
1
Bath
976
Sq Ft
$101/Sq Ft
Est. Value
About This Home
This home is located at 423 E 9th St, Davenport, IA 52803 and is currently estimated at $98,481, approximately $100 per square foot. 423 E 9th St is a home located in Scott County with nearby schools including Madison Elementary School, Frank L. Smart Intermediate School, and Central High School.
Ownership History
Date
Name
Owned For
Owner Type
Purchase Details
Closed on
Sep 19, 2025
Sold by
Sga Capital Holdings Llc
Bought by
Kcmo Cash Offer Llc
Current Estimated Value
Purchase Details
Closed on
Sep 11, 2025
Sold by
Kcmo Cash Offer Llc
Bought by
Urban Rehab Llc
Purchase Details
Closed on
May 10, 2019
Sold by
Future Capital Llc
Bought by
Sga Capital Holdings Llc
Home Financials for this Owner
Home Financials are based on the most recent Mortgage that was taken out on this home.
Original Mortgage
$41,000
Interest Rate
4%
Mortgage Type
New Conventional
Purchase Details
Closed on
May 8, 2019
Sold by
Helping Hand Capital Hldg
Bought by
Future Capital Llc
Home Financials for this Owner
Home Financials are based on the most recent Mortgage that was taken out on this home.
Original Mortgage
$41,000
Interest Rate
4%
Mortgage Type
New Conventional
Purchase Details
Closed on
Sep 12, 2018
Sold by
Future Capital Llc
Bought by
Helping Hand Capital Hldg
Purchase Details
Closed on
Oct 16, 2015
Sold by
Qc Rental Props Llc
Bought by
Quiet Capital Llc
Home Financials for this Owner
Home Financials are based on the most recent Mortgage that was taken out on this home.
Original Mortgage
$20,800
Interest Rate
3.91%
Mortgage Type
Future Advance Clause Open End Mortgage
Purchase Details
Closed on
May 21, 2013
Sold by
Ih Mississippi Valley Credit Union
Bought by
Qc Props Llc
Home Financials for this Owner
Home Financials are based on the most recent Mortgage that was taken out on this home.
Original Mortgage
$27,600
Interest Rate
3.52%
Mortgage Type
Future Advance Clause Open End Mortgage
Purchase Details
Closed on
Mar 26, 2013
Sold by
James Management Grp
Bought by
Ih Mississippi Valle Credit Union
Home Financials for this Owner
Home Financials are based on the most recent Mortgage that was taken out on this home.
Original Mortgage
$27,600
Interest Rate
3.52%
Mortgage Type
Future Advance Clause Open End Mortgage
Purchase Details
Closed on
Dec 31, 2010
Sold by
Nelson Richell L
Bought by
James Management Group Llc
Home Financials for this Owner
Home Financials are based on the most recent Mortgage that was taken out on this home.
Original Mortgage
$25,000
Interest Rate
4.44%
Mortgage Type
Future Advance Clause Open End Mortgage
Purchase Details
Closed on
Mar 31, 2010
Sold by
Nelson Richell L and Nelson Severen A
Bought by
Nelson Richell and Richell L Nelson Trust
Purchase Details
Closed on
Jul 11, 2006
Sold by
Dreher Tena M
Bought by
Stock Richell
Purchase Details
Closed on
Jan 9, 2006
Sold by
Grp Loan Llc
Bought by
Grp Loan Llc
Purchase Details
Closed on
Jan 5, 2006
Sold by
Grp Loan Llc
Bought by
Dreber Tena M
Purchase Details
Closed on
May 10, 2005
Sold by
Grp Loan
Bought by
Grp Ag Reo 2004 1 Llc
Create a Home Valuation Report for This Property
The Home Valuation Report is an in-depth analysis detailing your home's value as well as a comparison with similar homes in the area
Home Values in the Area
Average Home Value in this Area
Purchase History
| Date | Buyer | Sale Price | Title Company |
|---|---|---|---|
| Kcmo Cash Offer Llc | $36,500 | None Listed On Document | |
| Urban Rehab Llc | $43,000 | None Listed On Document | |
| Sga Capital Holdings Llc | $82,000 | -- | |
| Future Capital Llc | $70,000 | -- | |
| Helping Hand Capital Hldg | $75,000 | -- | |
| Quiet Capital Llc | $26,000 | Attorney | |
| Qc Props Llc | $47,500 | None Available | |
| Ih Mississippi Valle Credit Union | $15,000 | None Available | |
| James Management Group Llc | $20,000 | None Available | |
| Nelson Richell | -- | None Available | |
| Stock Richell | $14,500 | None Available | |
| Grp Loan Llc | -- | Gomez Title & Closing | |
| Dreber Tena M | $12,000 | Gomez Title & Closing | |
| Grp Ag Reo 2004 1 Llc | -- | None Available |
Source: Public Records
Mortgage History
| Date | Status | Borrower | Loan Amount |
|---|---|---|---|
| Previous Owner | Sga Capital Holdings Llc | $41,000 | |
| Previous Owner | Quiet Capital Llc | $20,800 | |
| Previous Owner | Qc Props Llc | $27,600 | |
| Previous Owner | James Management Group Llc | $25,000 |
Source: Public Records
Tax History
| Year | Tax Paid | Tax Assessment Tax Assessment Total Assessment is a certain percentage of the fair market value that is determined by local assessors to be the total taxable value of land and additions on the property. | Land | Improvement |
|---|---|---|---|---|
| 2025 | $1,654 | $76,480 | $25,200 | $51,280 |
| 2024 | $1,624 | $76,480 | $25,200 | $51,280 |
| 2023 | $1,618 | $76,580 | $25,200 | $51,380 |
| 2022 | $1,634 | $58,000 | $11,520 | $46,480 |
| 2021 | $1,634 | $76,130 | $11,520 | $64,610 |
| 2020 | $1,038 | $67,320 | $11,520 | $55,800 |
| 2019 | $1,366 | $47,810 | $11,520 | $36,290 |
| 2018 | $893 | $47,810 | $11,520 | $36,290 |
| 2017 | $918 | $35,330 | $11,520 | $23,810 |
| 2016 | $692 | $31,630 | $0 | $0 |
| 2015 | $692 | $36,650 | $0 | $0 |
| 2014 | $814 | $36,650 | $0 | $0 |
| 2013 | $800 | $0 | $0 | $0 |
| 2012 | -- | $41,630 | $10,860 | $30,770 |
Source: Public Records
Map
Nearby Homes
- 418 E 8th St
- 919 Leclaire St
- 715 Iowa St
- 928 Farnam St
- 3 Riverview Place
- 707 N Brady St
- 705 Brady St
- 1012 Arlington Ave
- 209 E 13th St
- 1108 Arlington Ave
- 818 Charlotte St
- 1136 Arlington Ave
- 1320 Grand Ave
- 320 E 14th St
- 1134 Tremont Ave
- 133 W 13th St
- 803 E River Dr
- 1429 Brady St
- 325 Kirkwood Blvd
- 1422 Arlington Ave
- 413 E 9th St Unit 3
- 820 Leclaire St
- 828 Leclaire St
- 409 E 9th St
- 814 Leclaire St
- 828 - 830 Leclaire St
- 828 - 830 Leclaire St
- 405 E 9th St
- 825 Iowa St
- 902 Leclaire St
- 422 E 9th St
- 424 E 9th St
- 418 E 9th St
- 414 E 9th St
- 406 E 9th St
- 412 E 9th St
- 919 1/2 Leclaire St
- 402 E 9th St
- 914 Leclaire St
- 402 E 8th St
Your Personal Tour Guide
Ask me questions while you tour the home.